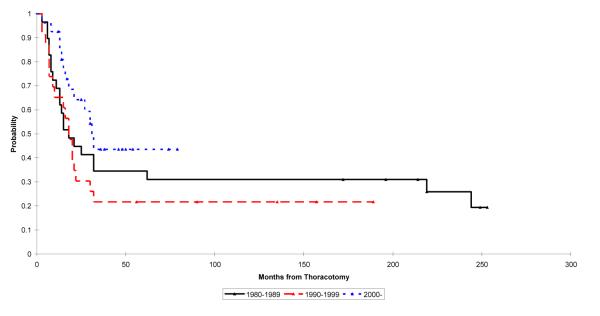
Fig. 5.
Kaplan–Meier plot showing survival of patients diagnosed with osteosarcoma with unilateral pulmonary metastases. The log rank test p-value for the difference between the survival rates in these groups is 0.14. Point estimates and 95% CIs for survival are as follows: 1980-1989 2 year: 0.45 (0.27, 0.62); 5 year: 0.35 (0.19, 0.51) 1990-1999: 2 year: 0.30 (0.13, 0.48); 5 year: 0.22 (0.05, 0.39) 2000-2005: 2 year: 0.64 (0.45, 0.83); 5 year: 0.44 (0.07, 0.80)

