
Figure 1. Cytoskeletal Associations and Subcellular Distribution of Mitochondria in MRL and C57BL/6 Fibroblasts.
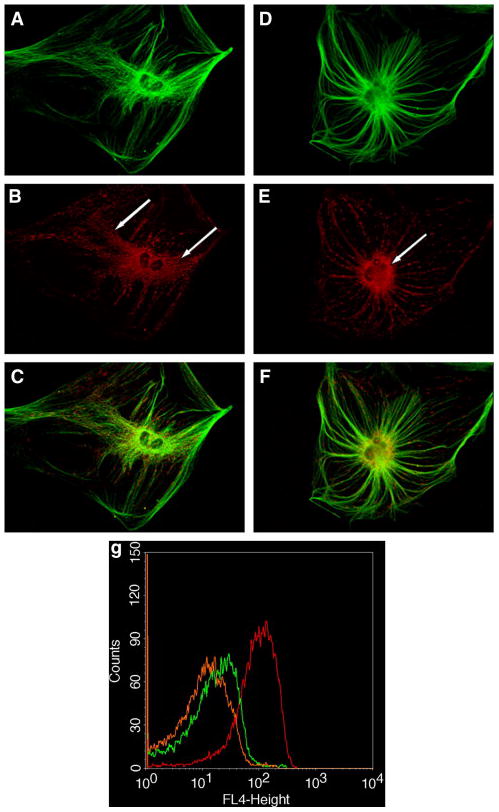
A. C57BL/6 fibroblast microtubules immunostained for α-tubulin. B. C57BL/6 mitochondria localized with Mitotracker Orange CMTMRos. C. Merge of A and B. D. MRL fibroblast microtubules immunostained for α-tubulin. E. MRL mitochondria localized with Mitotracker Orange CMTMRos. F. Merge of D and E. Arrows indicate the cytoplasmically distributed mitochondria in B6 cells that extend to the plasma membrane (B), and the perinuclear mitochondria in MRL cells (E). Bioenergetic and Biochemical Features. g. Mitochondrial Transmembrane Potential (ΔΨm). Frequency distributions of ΔΨm measured by DiIC1(5) fluorescence (FL4). C57BL/6 fibroblasts (red line), MRL fibroblasts (green), and MRL Day 17 Ear hole blastema cells (orange). h. Lactate Production in Primary Ear Skin Fibroblasts was measured in exponentially growing cells under ambient (21%) oxygen. i. Reactive Oxygen Species (ROS) Production in Primary Fibroblasts Measured by DHR123 Fluorescence. Tissue and Cellular Glutathione Content. j. Liver, k. Heart, l. Primary Ear Skin Fibroblasts.