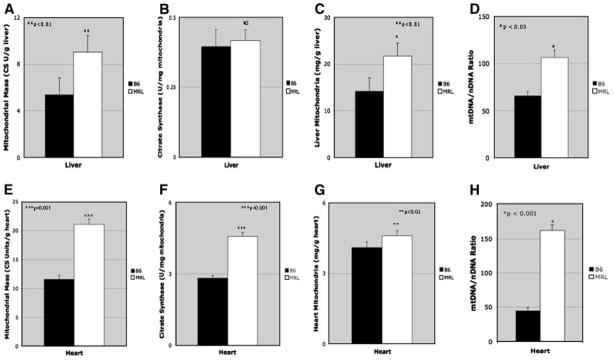
Figure 2. Tissue Mitochondria and Mitochondrial DNA Content.

Organ-specific mitochondrial citrate synthase content was measured as an indicator of the total amount of mitochondrial matrix present in liver (A) and heart (E). Mitochondrial matrix packing density was expressed in units of citrate synthase per mg mitochondrial protein (B and F). Tissue-specific total mitochondrial protein content (C and G). Mitochondrial DNA Content was measured by real-time, quantitative PCR (QPCR) and expressed as a ratio of mtDNA to the single-copy nuclear marker SDHa in D. Liver, and H. Heart.
