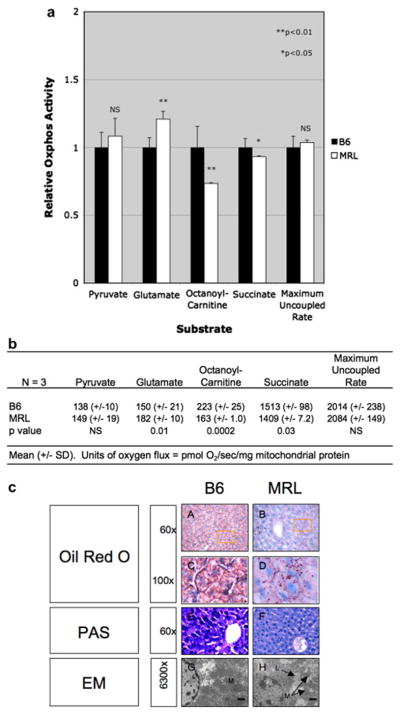
Figure 6. Mitochondrial Oxidative Phosphorylation and Histology.

a. Substrate-Specific Respiration of Liver Mitochondria. Values were expressed as a ratio to B6. b. Substrate-Specific oxygen fluxes in pmol/sec/mg. c. Liver Histology and Ultrastructure. Frozen sections were stained with oil red O for neutral lipid (A–D), or PAS for glycogen (E–F). Panels C and D are enlargements of the indicated regions from panels A–B. Cellular ultrastructure was evaluated by electron microscopy (EM) in liver from B6 (G), MRL (H) mice. The bar is 1 μm. (M=mitochondria, L=lipid droplet).
