
Figure 4.
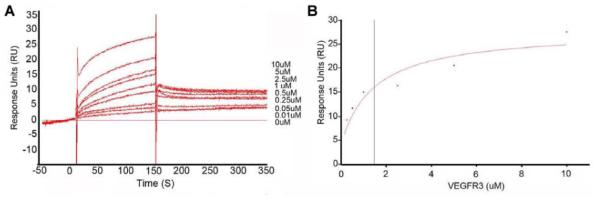
(A) Interaction of mEP with various concentrations of VEGFR-3-Fc, as shown by a representative sensorgram of fitted kinetic data. (B) The fitted curve is the solid red line super-imposed on the responses, and the VEGFR-3 concentrations are 0, 0.01, 0.05, 0.25, 0.5, 1.0, 2.5, 5.0, and 10 μM.