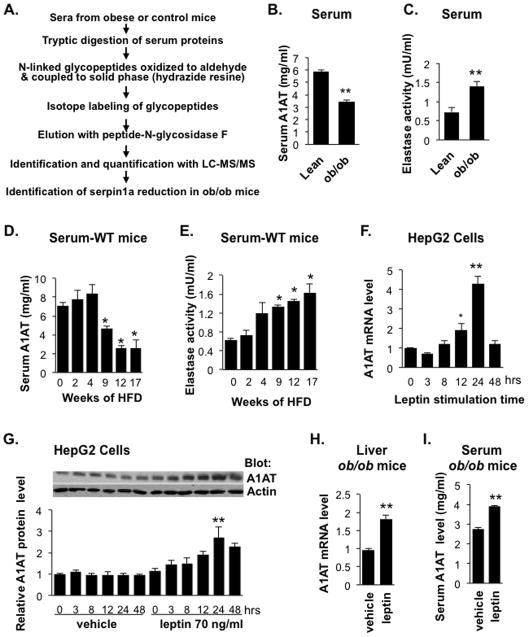
Figure 1. Changes in Serum A1AT Levels and NE Activity in Obese Mice and the Effect of Leptin on A1AT Expression.
(A) Schematic of the glycoprotein enrichment and quantitative serum proteomic approach for comparing serum protein profiles of male obese and lean mice. Serum α1-antitrypsin (A1AT) levels (B) or NE activity (C) in ob/ob mice (12-week-old male) and age-matched lean C57BL/6 controls were quantified by ELISA (A1AT) or a colorimetric assay (NE activity). Data are presented as mean ± SEM of 6 to 8 animals with triplicate samples. **P < 0.01. (D) Serum A1AT levels or (E) NE activity in male C67BL/6 mice at 7 weeks old fed 60% HFD for 2 to 17 weeks. Data are presented as mean ± SE of 5 to 9 animals with triplicate samples. *P < 0.05. (F and G) Leptin regulates A1AT expression in HepG2 cells. Cells were serum starved overnight and incubated with leptin (75 ng/ml) for the indicated times. (F) A1AT mRNA levels were determined by qRT-PCR and (G) A1AT protein levels were analyzed by Western blotting followed by quantification of band intensity. Results are presented as fold change relative to vehicle-treated control cells and are the mean ± SEM of 4 independent experiments. **P < 0.01. (H and I) Leptin stimulates A1AT expression in vivo. Alzet osmotic pumps were implanted subcutaneously into ob/ob male mice (10 weeks of age) and programmed to deliver vehicle or 10 μg/day of leptin for 7 days. Liver A1AT mRNA (H) and serum A1AT protein (I) were quantified by qRT-PCR and ELISA, respectively. Data are presented as mean ± SEM (n = 5). **P < 0.01. Also see Table S1 and Figure S1.

