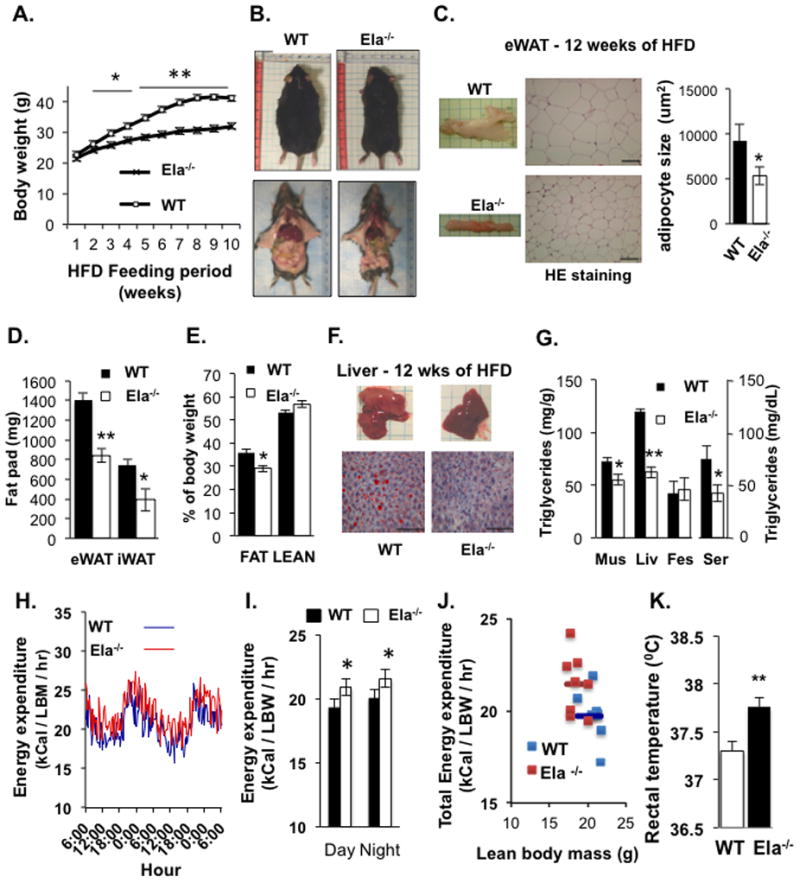
Figure 3. Improved Metabolic Profiles in Neutrophil Elastase-Deficient Mice Fed with a HFD.

(A) Mean bodyweights of C57BL/6 (WT) and neutrophil elastase-deficient (Ela−/−) mice during 10 weeks on 60% HFD (n = 9). *P < 0.05, **P < 0.01, Ela2−/− vs WT. (B) Representative images of mice sacrificed after feeding the HFD for 12 weeks. (C) Images of epididymal white adipose tissue (eWAT), H&E staining, and mean area of the adipocytes calculated with ImageJ software. Scale bars = 100 μm. (D) Weight of epididymal (eWAT) and inguinal (iWAT) fat pads of mice fed a HFD for 9 weeks (n = 9). *P < 0.05, **P < 0.01. (E) Adipose tissue as a percentage of total bodyweight in mice fed the HFD for 9 weeks, measured by MRI (n = 9). *P < 0.05. (F) Representative images of livers and histologic sections (Oil Red O and methylene blue staining) of livers from WT and Ela2−/− mice fed a HFD for 12 weeks. Scale bars = 100 μm. (G) Triglyceride content of muscle (mus), liver (liv), feces, and serum (ser) of mice fed with the HFD for 12 weeks. Samples were collected after mice were fasted for 4 hrs. Energy expenditure (H, I. J) of mice fed with the HFD diet for 10 weeks and then monitored in metabolic cages for 48 hrs (n = 8 mice per group). Lean body weight: WT, 20.8 ± 0.76 (g); Ela2−/−, 18.5 ± 0.92 (g); Fat mass: WT, 15.1 ± 0.12 (g); Ela2−/−, 9 ± 0.13 (g). (K) Mouse rectal temperatures measured with a rectal probe (BAT-12 Microprobe Thermometer, Physitemp Instruments) between 4 to 5 pm after feeding with a HFD for 6 to 7 weeks. Data are presented as mean ± SEM from three experiments. **P < 0.01, Ela2−/− vs WT. Also see Figures S3 & S4.
