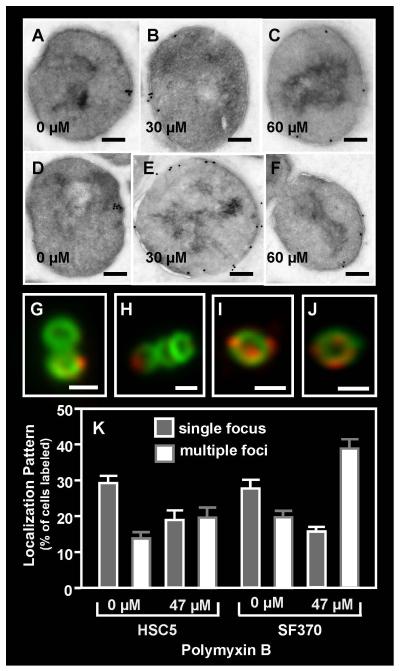
Figure 4. Redistribution of ExPortal proteins following sub-lethal polymyxin B challenge.
The distribution of SecA (A, B, C) and HtrA (D, E, F) on S. pyogenes SF370 was assessed by immunogold electron microscopy following challenge with polymyxin B at the concentrations indicated in the Figure (scale bar = 200nm). The distribution of HtrA was also assessed by immunofluorescent microscopy in the absence of (G, H) and following challenge with polymyxin B at 47 μM (I, J) and was quantitated as described previously (scale bar = 500nm) (K). Data represents the mean and SEM derived from at least 3 independent experiments and examination of a minimum of 1000 stained cells. In untreated cultures, the number of SF370 or HSC5 cells with a single focus was significantly higher than any other staining pattern (P < 0.05), whereas in polymyxin B-treated cultures, the number of streptococcal cells with multiple foci was significantly higher (P < 0.05).

