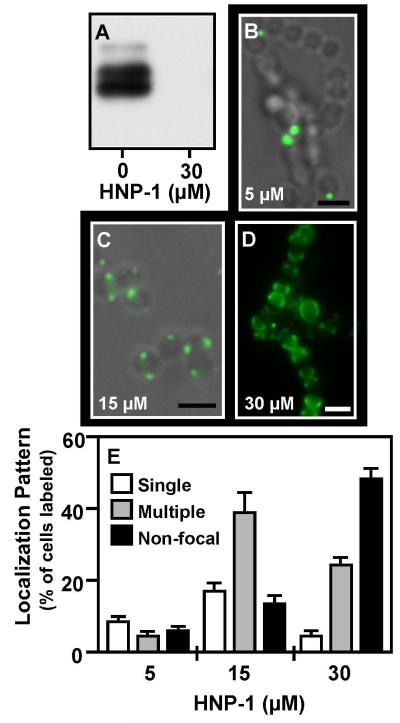
Figure 6. Focal localization and inhibition of SpeB expression by HNP-1.
Cultures were challenged with HNP-1 or by 5-FAM-HNP-1 at the concentrations indicated. Expression of SpeB was evaluated by a Western blot analysis (A) and binding to the S. pyogenes surface was assessed using fluorescent microscopy (B, C, D). Presented are overlays of fluorescent and phase images (B, C) or the fluorescent image alone (D) (scale bar = 1μm). Staining patterns were quantitated as described previously (E). Data represents the mean and SEM derived from at least 3 independent experiments and examination of a minimum of 1000 stained cells. At minimal concentration the number of cells with single foci is significantly higher than all other staining patterns, whereas multiple foci and hemisphere staining predominated significantly at higher peptide concentrations (P < 0.05).

