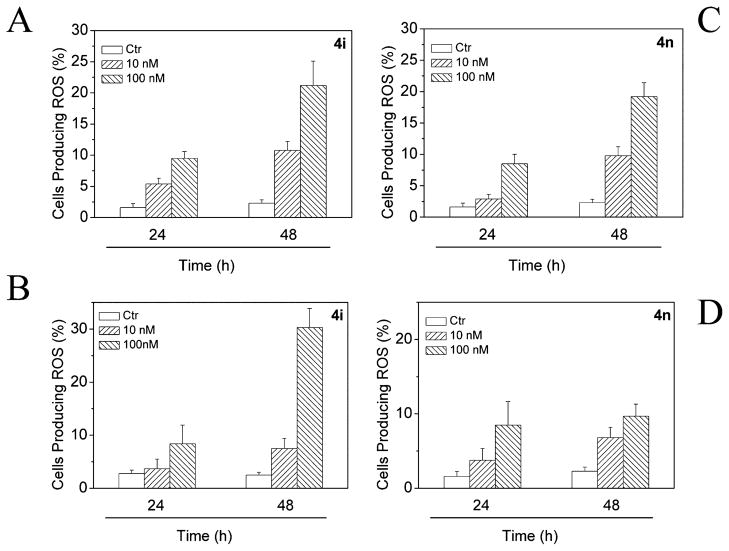
Figure 7.
Mitochondrial production of ROS in HeLa cells following treatment with compound 4i (A, B) or compound 4n (C, D). After 24 or 48 h incubations, cells were stained with H2-DCFDA (A, C) or HE (B, D) and analyzed by flow cytometry. Data are presented as the mean ± SEM of three independent experiments.

