Fig. 10.

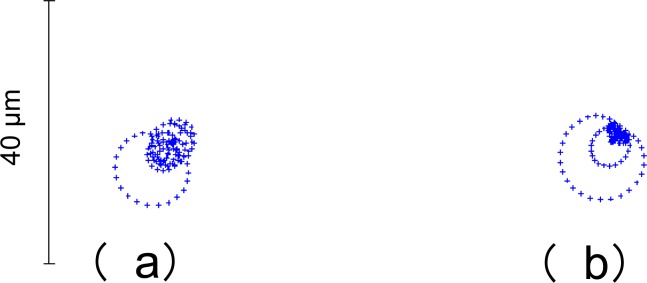
Spot diagrams of the eye with typical magnitude of monochromatic aberrations. (a) Without involving the angle, (b) involving the angle.

Spot diagrams of the eye with typical magnitude of monochromatic aberrations. (a) Without involving the angle, (b) involving the angle.