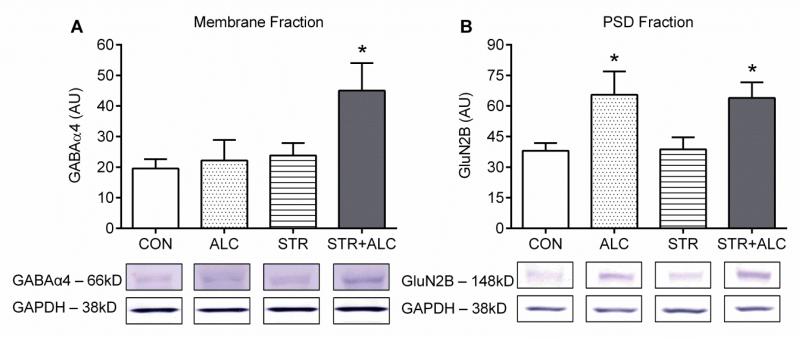
Figure 5.
Neurotransmitter receptor protein expression in hippocampus (Arbitrary Units, mean±SEM). All bands were not analyzable, thus, group sizes differ (GABAα4: CON, STR, STR+ALC – n=7, ALC – n=5; GluN2B: CON – n=6, ALC and STR – n=7, STR+ALC – n=8). (A) GABAα4 analysis shows a significant difference STR+ALC > CON/ALC/STR groups, asterisk |*| p<0.05. (B) GluN2B analysis shows a significant difference, ALC/STR+ALC > CON/STR, asterisk |*| p<0.05.

