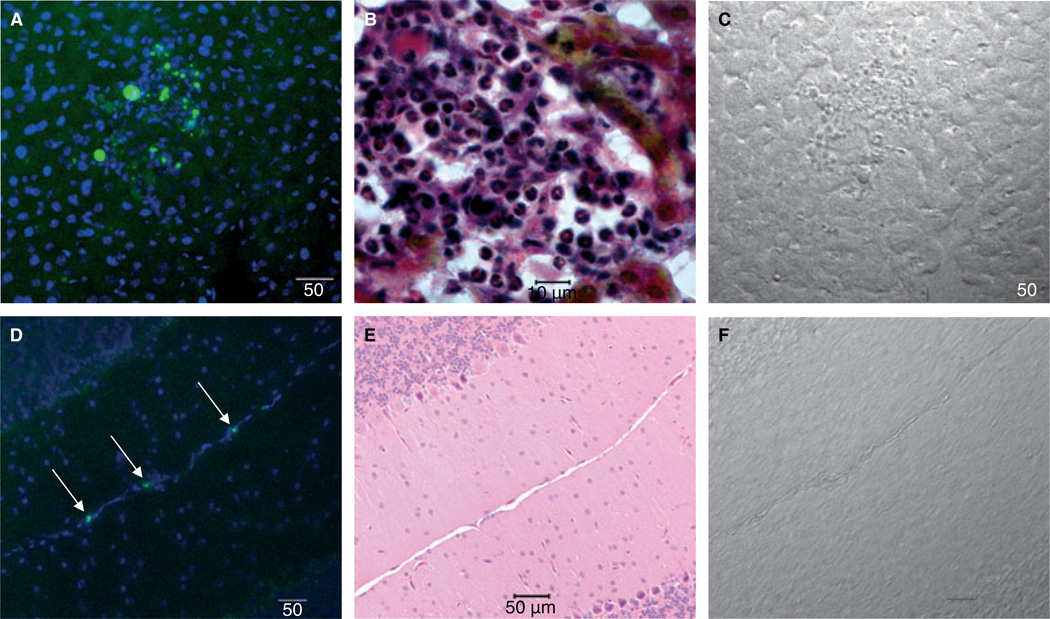
Fig. 2.
Fibrin deposition in liver and brain of TFPI+/−/TMpro/pro mice. Panels A, B and C are liver; panels D, E and F are brain. All panels are at 20× magnification with 50 micron scale bars except panel B that is 100 × magnification with 10 micron scale bar. (A) Fibrin deposits (green) within the interstitia of the liver from a TFPI+/−/TMpro/pro mouse detected using a fluorescently labeled peptide (green) that specifically binds to fibrin–fibronectin complexes [21]. Cell nuclei are stained blue with DAPI. (B) Martius, Scarlet and Blue fibrin stain of a representative liver lesion. This stain colors fibrin red, fresh fibrin yellow and connective tissue blue. Multiple neutrophils are present within the lesion. (C) Brightfield image of the liver lesion presented in panel A. (D) Fibrin deposition (green) within vessels of the pia matter surrounding the cerebellum of TFPI+/−/TMpro/pro mice detected using the fibrin binding peptide (arrows). Cell nuclei are stained blue with DAPI. (E) Hematoxylin and eosin stain of section similar to that shown in panel D showing the pia matter of the cerebellum where the fibrin deposition was most commonly observed. (F) Brightfield image of brain presented in panel D.

