FIG. 2.

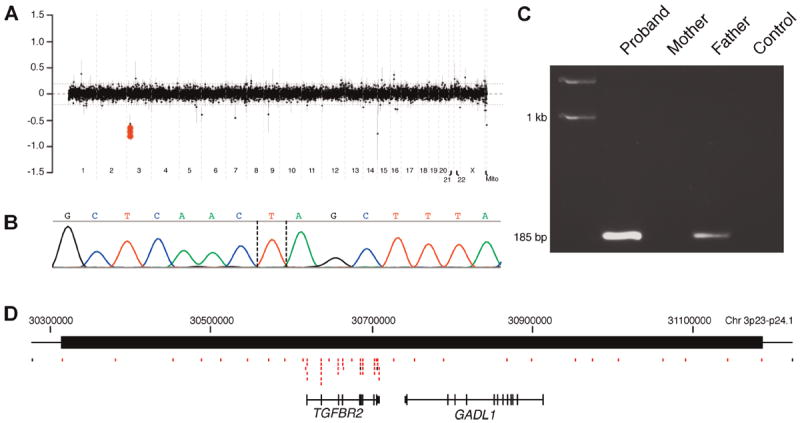
A: Clinical aCGH (CMA V8.1 OLIGO) plot showing a deletion on chromosome 3q24.1-q23. The proximal breakpoint was mapped between 31,214,839 and 31,176,203 and the distal breakpoint between 30,287,071 and 30,325,687. B: Chromatogram showing DNA sequence of the junction fragment. Dashed lines show possible breakpoints. C: 1% Agarose gel demonstrating the presence of the family-specific fragment amplified from the patient’s and the father’s peripheral blood lymphocytes. Note the weaker intensity of the PCR band for a given reaction volume in the father indicating a low level mosaicism. D: Schematic diagram of the genomic structure of the deleted region. Red boxes represent CGH oligonucleotides with log ratios below −0.30 [Color figure can be viewed in the online issue, which is available at www.wileyonlinelibrary.com].
