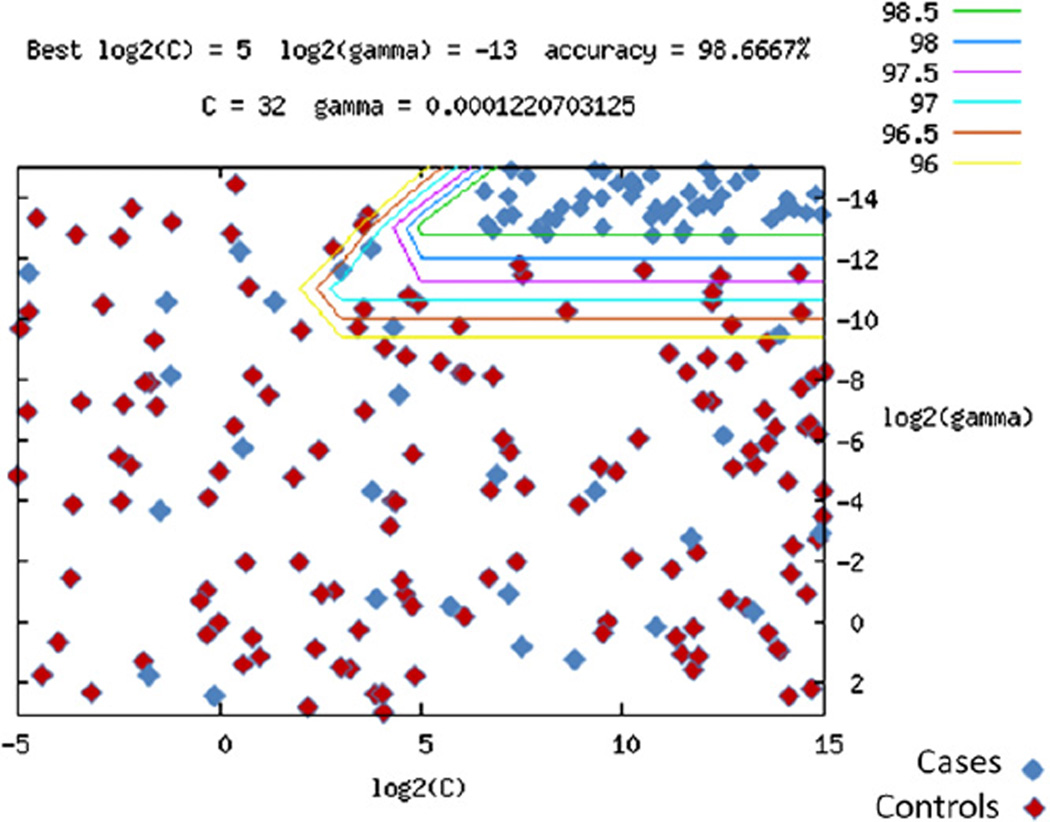
FIG 2.
SVM prediction of CVID status. Plotted are log base 2 SVM scaling values of cost C (the penalty parameter of SVMs) and γ (1/number of variables) from LIMSVM software. Data were coded as +1 for affected and −1 for unaffected subjects. Genotype was scaled as follows: AA, 0; AB, 0.5; and BB, 1. Lines represent modeling with increasing resolution, with the green line representing the final model solution. The model was generated by using the discovery cohort and control subjects, whereas the subjects represented (blue, CVID cases; red, control subjects) were from the separate replication cohort.

