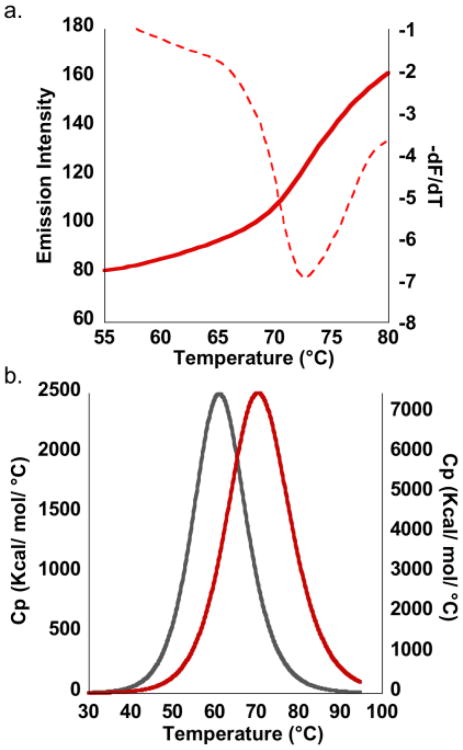
Fig. 4.
Melting profiles for hSGQ•DOX (LiPB pH 7.4) as determined by (a) variable temperature FRET experiments, monitoring the donor emission at increasing temperatures. The reported Tm is the inflection point in the melting profile as determined by the minimum in the first derivative plot (dashed red line). (b) Overlay of the DSC endotherm for hSGQ (grey curve) and for hSGQ•DOX (red curve), showing an enhancement in the thermal stability of the hexadecamer when interacting with the drug.

