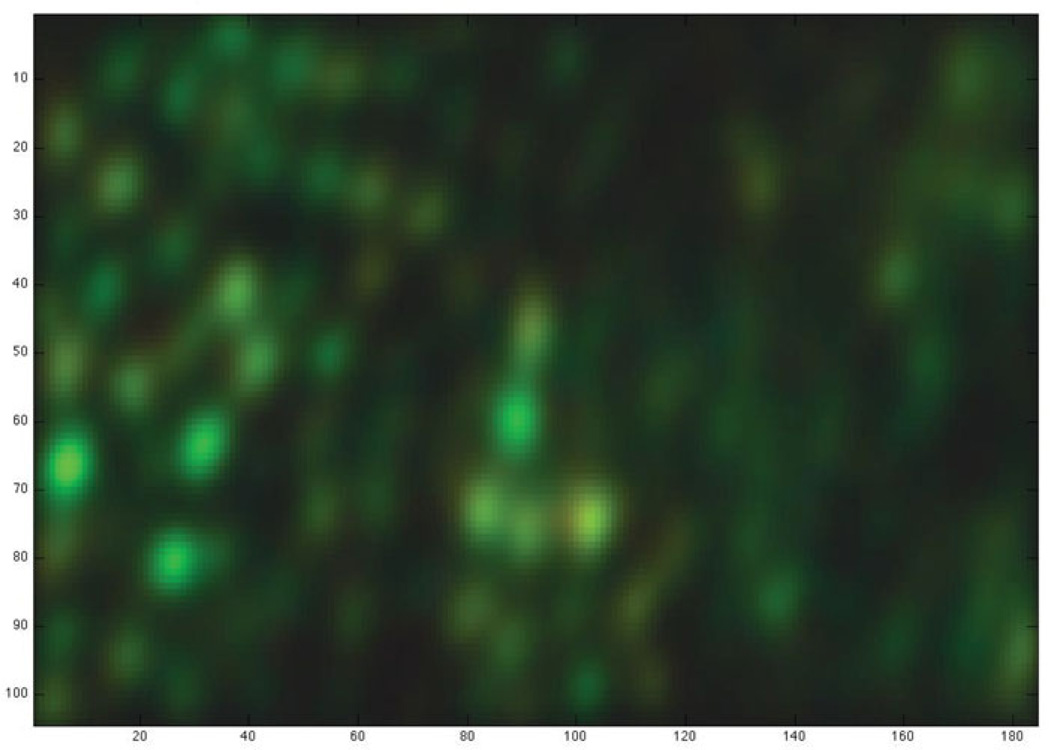
Figure 1.
Visual summary of the evidence for cones across spatial locations. Dark areas show less evidence for the presence of a cone, while red, green and blue areas show evidence for cones of the corresponding types. The colors displayed, which cannot be assigned meaningful units, were obtained as explained in the main text. The axes count the number of possible cone positions considered, which is 4 times the number of pixels in the stimulus: the evidence map is supersampled by a factor of 4 compared to the original stimulus and STAs.

