
Figure 2.
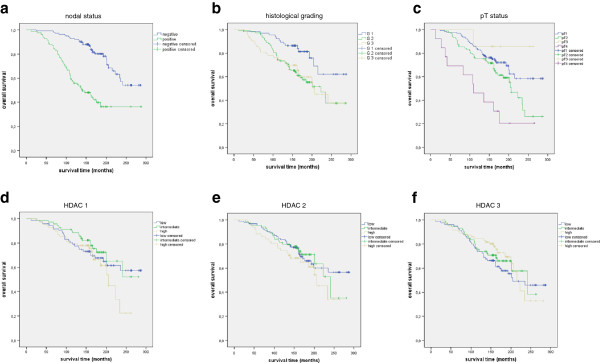
Overall survival. Figure 2 shows the overall survival for the whole cohort. The nodal status (Figure 2a; p<0.001), the histological grading (Figure 2b; p=0.009) as well as the pT status (Figure 2c; p<0.001) reached statistical significance. The expression of HDAC1 (Figure 2d; p=0.557), HDAC 2 (Figure 2e; p=0.316) and HDAC 3 (Figure 2f; p=0.536) did not reach significant prognostic relevance regarding the overall survival.