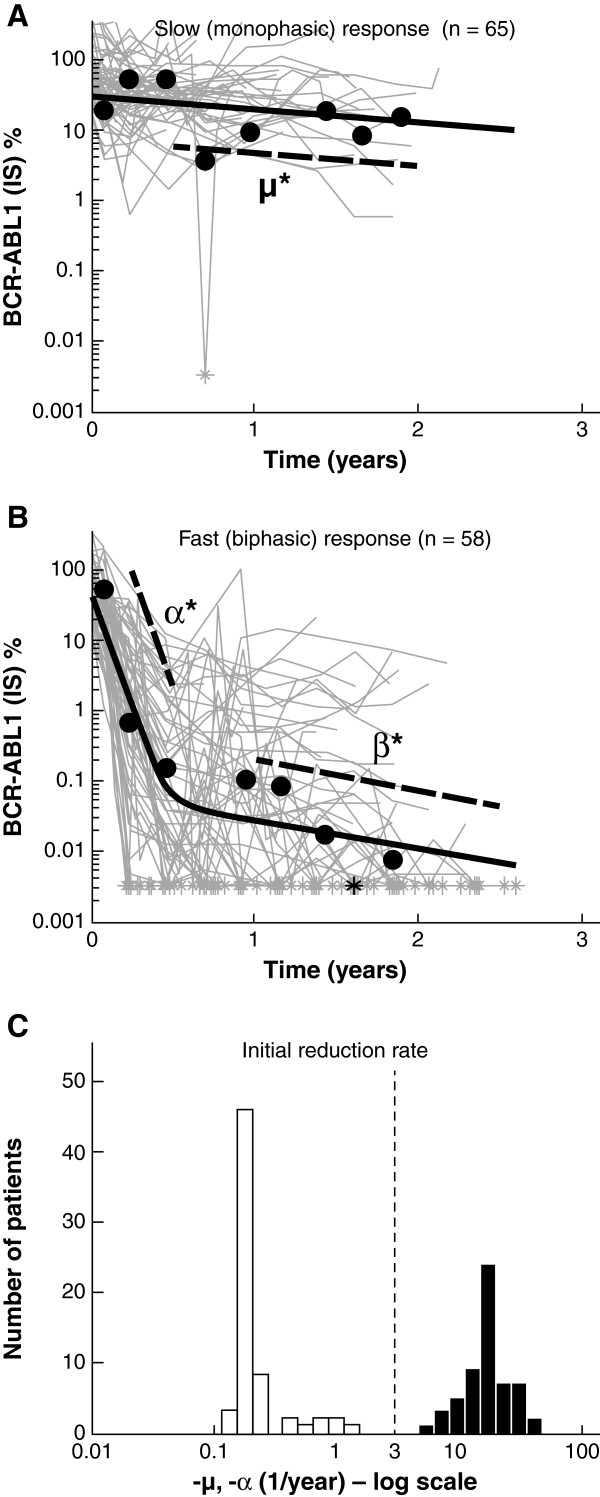
Figure 1.
BCR-ABL1 (international scale [IS])% for all 123 patients in this analysis, divided into two groups, with an example patient shown in black within each group: (A) slow monophasic responders (n = 65) with μ = −0.4/year for the example patient and (B) fast biphasic responders (n = 58) with α = −15.1/year and β = −0.9/year for the example patient. The μ*, α*, β* parameters are shown for the example patient, where μ* = μlog10e, α* = αlog10e, and β* = βlog10e. The asterisks (*) indicate when a BCR-ABL1 (IS)% measurement fell below 0.0032% (= 100 × 10-4.5), the approximate limit of quantitation of the assay for all laboratories in the International Randomized Study of Interferon and STI571 trial; (C) histogram of the initial reduction rates μ and α. Note that there is no overlap between the two populations and that the vertical dashed line at −3/year demonstrates where the separation occurs.

