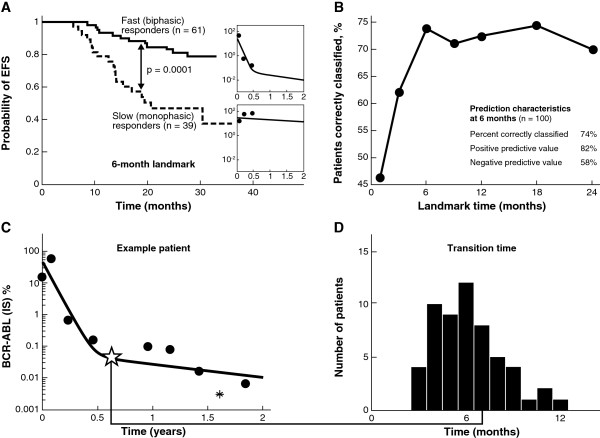
Figure 4.
(A) Event-free survival (EFS) at 2 years based on patient classification using only the first 6 months of data. The difference between the EFS curves was found to be statistically significant at p = 0.0001 by a log-rank test; (B) the percentage of patients correctly classified as having an event at year 2 as a function of the amount of data used to classify each patient; (C) example patient: the ✩ indicates the transition point, defined as the point of maximum curvature where fast responders transition from the α to the β phase; the * corresponds to measurements below the limit of quantification of the polymerase chain reaction assay, assumed to be 0.0032% for all labs; (D) histogram of transition times between the α and β phases. Abbreviation: IS = international scale.

