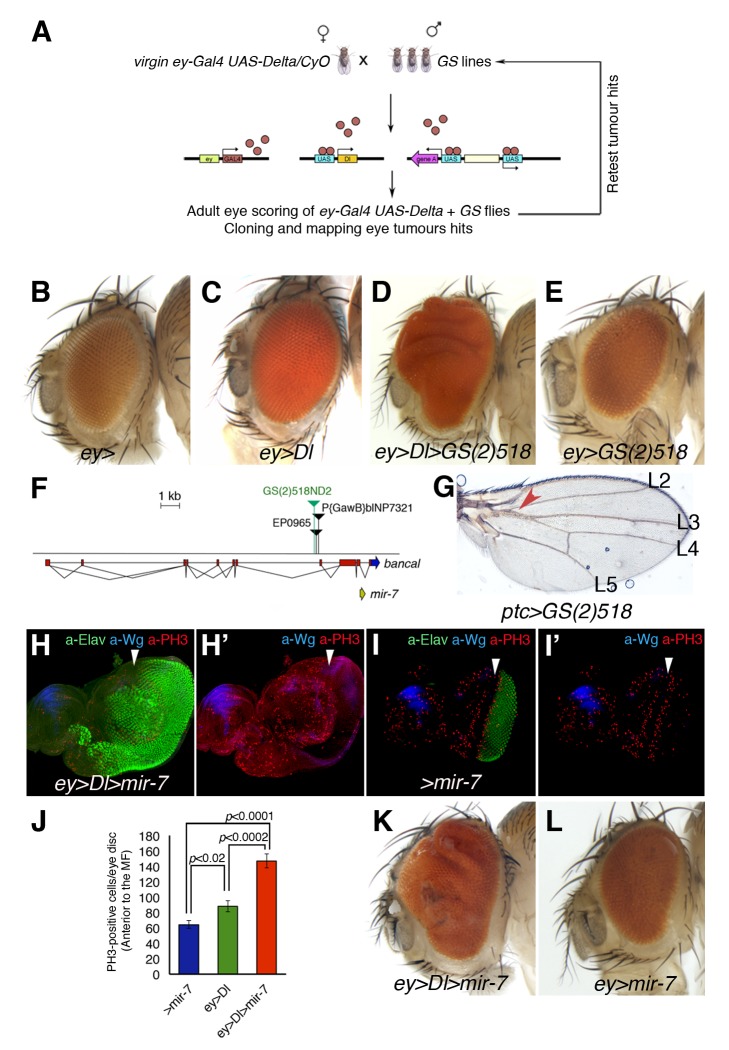
Figure 1. The Conserved MicroRNA miR-7 co-operates with Notch in D. melanogaster oncogenesis.
(A) A schematic outline of the Gene Search (GS) gain-of-expression screen for Notch co-operating oncogenes in the developing Drosophila eye. (B–E and K–L) Adult heads of control female ey-Gal4 wild-type eye size (B) and combinations between GS line, UAS transgenes, and ey-Gal4 are shown. (C) Dl expression under the control of ey-Gal4 results in a mild overgrowth in the eye (130% larger than wild type size). (D) Introducing the GS(2)518ND2 line enhanced overgrowth by Dl (>320%, see also Figure S2). (E) The overexpression of gene(s) affected by the GS(2)518ND2 line alone causes no overt eye overgrowth. (F) Scheme of the GS(2)518ND2 insertion. (G) Overexpression of the GS(2)518ND2 line driven by ptc-Gal4 showed the typical wing vein L3–L4 fusion. (H–I′) Confocal images of third instar eye-antennal discs stained for the mitotic marker PH3 (red), Wg (blue) to define the DV axis, and the neuronal marker Elav (green) of the indicated genotypes. White arrowheads indicate the position of the MF. The co-expression of UAS-mir-7 with UAS-Dl causes eye disc overgrowth and a front of retinal differentiation highly disorganized (H, compare with control sibling eye disc in I). (J) Quantification of mitotic cells labelled by PH3 anterior to the MF of the genotypes: ey>Dl>mir-7 (red bar), ey>Dl (green bar), and wild-type sibling discs +/UAS-mir7 (>mir-7, blue bar). Data shown represent the mean ± s.e.m. of total PH3 measurement in 20 eye discs per genotype. P values were calculated by the unpaired Student's t test. (K–L) Adult heads overexpressing mir-7 driven by ey-Gal4 in the presence (K) or the absence (L) of the UAS-Dl transgene. See also Figures S2 to S4 for supplementary data.

