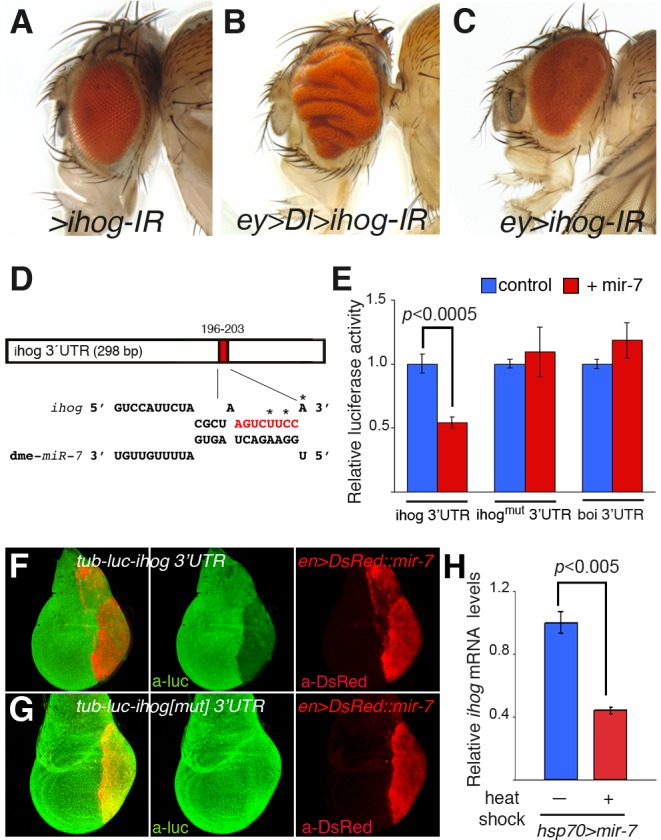
Figure 2. Tumourigenesis promoted by miR-7 via direct repression of interference hedgehog (ihog).

(A–C) Adult heads of female control UAS-ihog-IR (A) and combinations of UAS-ihog-IR and ey-Gal4 in the presence (B) or the absence (C) of the Dl transgene. (D) Computer predicted consequential pairing of ihog target region (top) and miRNA (bottom). The conserved seed match (8 mer) in the 3′UTR of ihog is in red. (E) Luciferase assay in Drosophila Schneider (S2) cells co-transfected with mir-7 (red bars) or the empty vector (blue bars), together with a firefly luciferase vector containing the ihog3′UTR (ihog3′UTR), or the luciferase vector with mutations in the seed sequence (asterisks in D, ihogmut3′UTR) or control boi3′UTR (boi3′UTR). Firefly luciferase activity was measured 48 h after transfection and normalized against Renilla luciferase. The values represent the mean ± s.e.m. of three or four independent experiments. Differences in ihog(mut) and boi luciferase levels were not statistically significant between treatments. (F–G) Confocal images of mid third instar wing discs carrying the tub-luc::ihog-3′UTR (F) or the tub-luc::ihogmut3′UTR sensor (G) and overexpression of mir-7 by en-Gal4 (en>DsRed::mir-7, red) and stained with anti-luciferase antibody (green). (H) Differences in ihog mRNA levels assessed by RT-qPCR between hsp70>mir-7 larvae subjected to heat shock treatment (red bar) or not (blue bar). Values represent the mean ± s.e.m. of three independent experiments. P values were calculated by the unpaired Student's t test.
