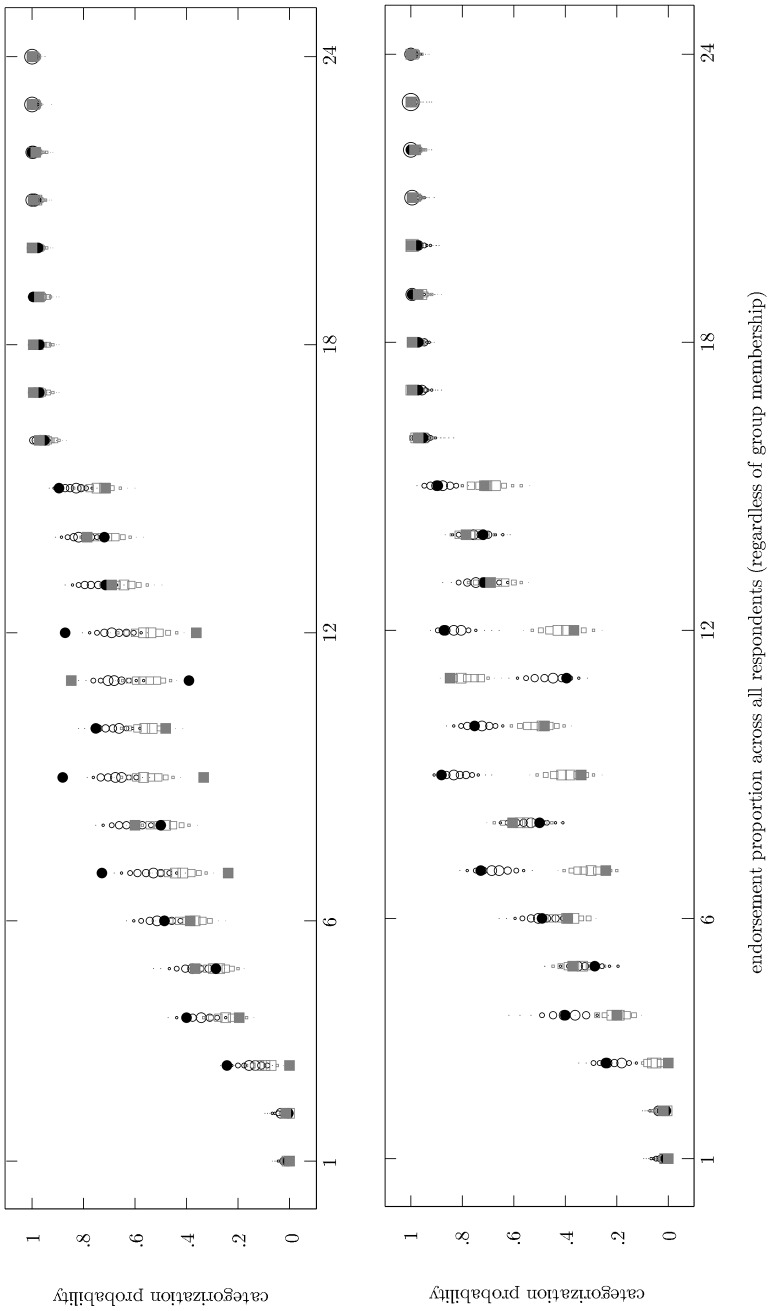
Figure 1. Posterior predictive distribution of the one-group model (upper panel) and the two-group model (lower panel) for the sports categorization data.
Items are ordered along the horizontal axes according to the number of participants out of 250 who endorsed them as category members. Filled black circles show per item the proportion of participants from Group 1 who provided a positive categorization response. Filled gray squares show per item the proportion of participants from Group 2 who provided a positive categorization response. Outlines of circles and squares represent the posterior predictive distribution of positive categorization decisions for Group 1 and Group 2, respectively. The size of these outlines is proportional to the posterior mass that is given to the various categorization probabilities.

