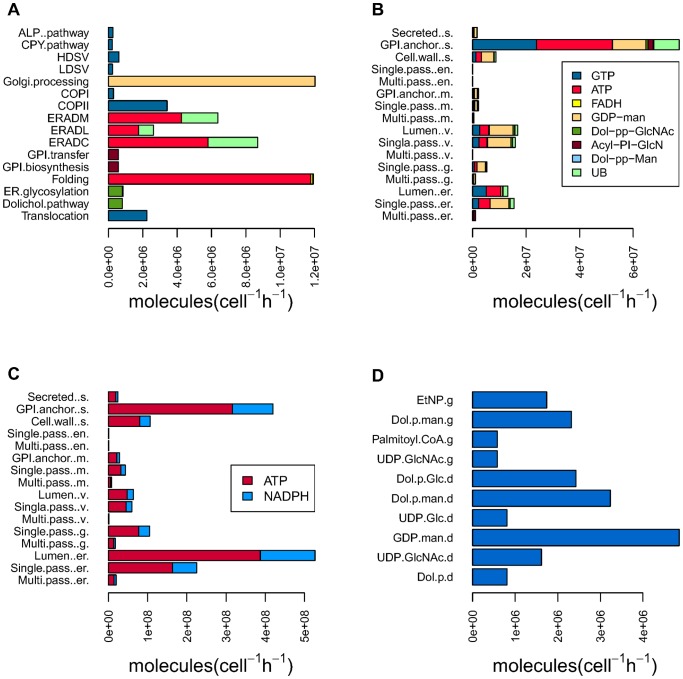
Figure 5. Estimation of the secretory machinery metabolic demands.
(A) Energy cost and metabolic demand of each subsystem. Yeast steady-state protein abundance data [37] were integrated with the reconstructed network (a total 11684 of protein specific generated reactions) to estimate the different metabolic demands (molecules cell−1 h−1) for different subsystems. The horizontal bar-plot shows the calculated the metabolic precursors consumption (x axes) for each subsystem (y axes). UB (Ubiquitin) was considered to be metabolite as it is precursor for labelling mis-folded proteins in order to target them for degradation (see Materials & Methods). (B) The metabolic demands have been calculated for each compartment. In each compartment, the proteins have been divided into be single or multiple- pass transmembrane, GPI-anchored or luminal. Panel C shows the bar-plots of the protein synthesis costs (ATP and NADPH). Panel D shows the metabolic costs of the Dolichol and GPI biosynthesis pathways (the metabolic precursors name are indicated in the y axes ended by d or g representative for Dolichal or GPI biosysntheis).

