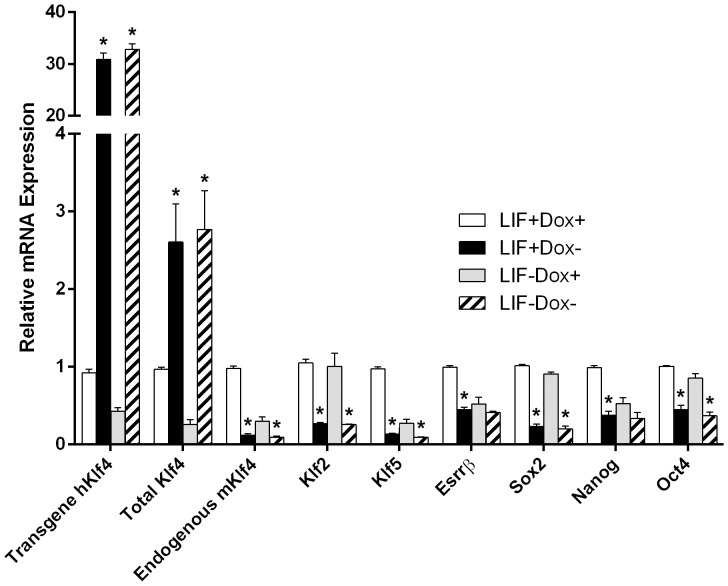
Figure 4. Gene expression effects of hKlf4 induction.
The inducible hKlf4 mES cells were cultured with or without LIF for 1.5 days. Real-time RT-qPCR quantified the relative mRNA levels. Bars represent the mean±SEM of at least two independent experiments with two repeats each. LIF+Dox− was compared with LIF+Dox+, and LIF−Dox− was compared with LIF−Dox+ for statistical significance. *, p<0.05.

