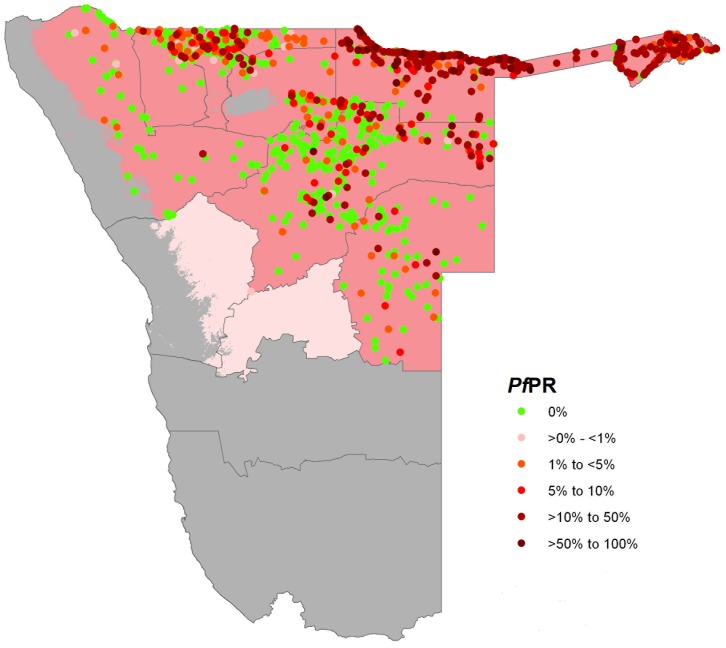
Figure 3. Map of contemporary first level administrative units of Namibia showing the spatial limits of P.falciparum transmission (dark pink) and location of PfPR survey data from the year 1967 to 1992.
Where survey data are available for a location in more than one year, the highest PfPR value is displayed top. Light pink areas support unstable transmission and grey areas are malaria free. Footnote: A temperature suitability index (TSI) for malaria transmission at 1×1 km spatial resolution [10] was used to delineate areas in Namibia where malaria is unlikely to occur, defined as areas where TSI was equal to zero. TSI was constructed using monthly temperature time series within a biological modelling framework to quantify the effect of ambient temperature on sporogony and vector survivorship and determine the suitability of an area to support transmission globally separately for both P. falciparum and P. vivax. Extreme aridity was defined using synoptic mean monthly enhanced vegetation index (EVI) data [11] to classify into areas unlikely to support transmission, defined as areas where EVI was <0.1 in any two consecutive months of the year [7], [12]. In Namibia TSI and aridity identified the Namib Desert on the Atlantic Coast, parts of the Kalahari Desert in the South and the Etosha and other smaller saltpans as areas that were too hot or dry to support malaria transmission. Finally areas defined as operationally risk free based on reported incidences [2], [6], [7], [24] were identified (southern parts of the regions of Kunene and Omaheke and all of Erongo, Hardap, Khomas and Karas). It is hard to eliminate the possibility of any risks and therefore the parts of Erongo, the whole of Khomas and the southern parts of Omaheke were classified to be of unstable transmission where aridity and temperature do not exclude transmission.

