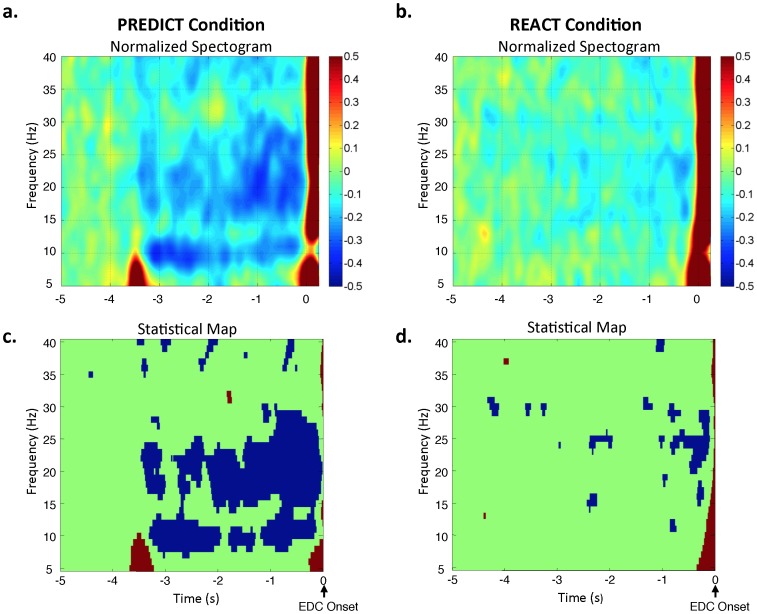
Figure 3. Movement-related oscillations were affected by the predictability of the imperative release cue.
The upper plots show the grand average time-frequency spectrograms at the C3 electrode overlying the contralateral sensorimotor region for the PREDICT (A) and REACT (B) conditions. Magnitudes have been normalized to the power over the pre-warning cue interval (−5 to −4.25 s). Note the marked suppression of oscillations in the alpha band (8–12 Hz) immediately following the warning cue and in the beta-band (15–30 Hz) during the 1500 ms time period immediately preceding the onset of wrist extensor (EDC) muscle activity (0 ms) for the PREDICT task. In contrast, the suppression of MRCOs occurred immediately prior to EMG onset for the REACT task and was confined to the beta-band. Plots C and D show the results of the statistical analysis of the normalized time-frequency spectrograms at the C3 electrode for the PREDICT (C) and REACT (D) conditions. Significant (p<0.05) increases (red) and decreases (blue) in MRCOs relative to baseline activity are shown.

