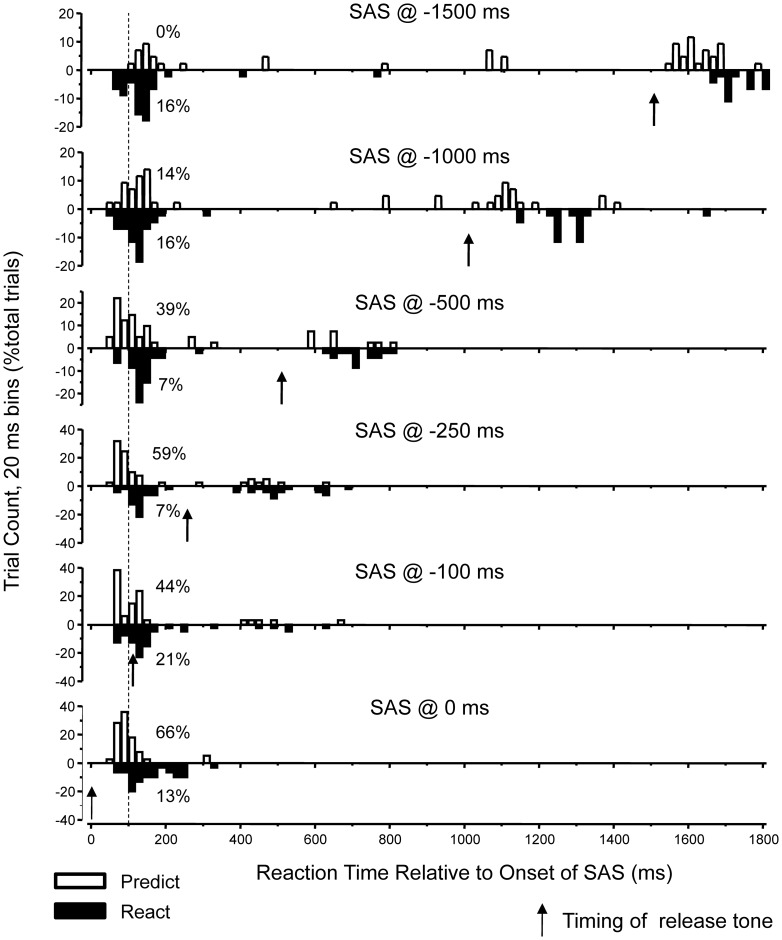
Figure 5. Summary of the effects of a startling acoustic stimulus (SAS) on the timing of movement release.
Reaction times relative to the onset of the SAS were sorted into 20 ms bins. The histograms show the percentage of trials within each reaction time bin for both the PREDICT (open rectangles) and REACT (filled rectangles) tasks. The vertical black arrows show the timing of the imperative release tone. The vertical dashed line is drawn at reaction time of 100 ms. The percentage of trials with reaction times less than 100 ms is shown to the right of the histogram distributions. Note that fast reaction times were common for the PREDICT condition when the SAS was presented 250 ms or less before the imperative cue.

