
Figure 4. Qualitative comparison of the rate of growth in loudness as a function of frequency with empirical predictions.
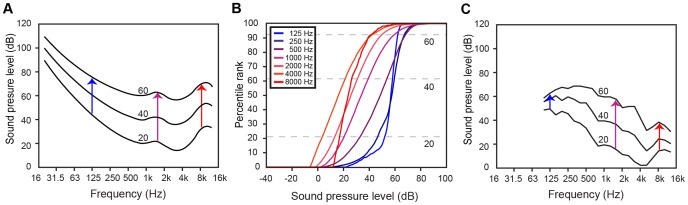
(A) Equal loudness contours for 20, 40, and 60 dB SPL at 1 kHz, calculated from the ISO standard [18]. The rate of loudness growth (arrows) is greater for low and very high frequencies than for middle frequencies. (B) The CDFs for SPLs of individual harmonic tones, derived from the database for standard octave frequencies. The slopes of the CDFs decrease as frequency increases to ∼4 kHz, and then increase again at higher frequencies. Dotted lines indicate the percentile ranks for 20, 40 and 60 dB on the 1-kHz tone CDF. (C) Empirically predicted “equal percentile rank” contours taken from CDFs in (B). Contours were plotted as the SPL values from the CDFs (obtained for standard 1/3–octave frequencies) that had the same percentile rank as 20, 40, and 60 dB on the 1-kHz CDF. The rate of loudness growth as a function of frequency is similar to that in (A).