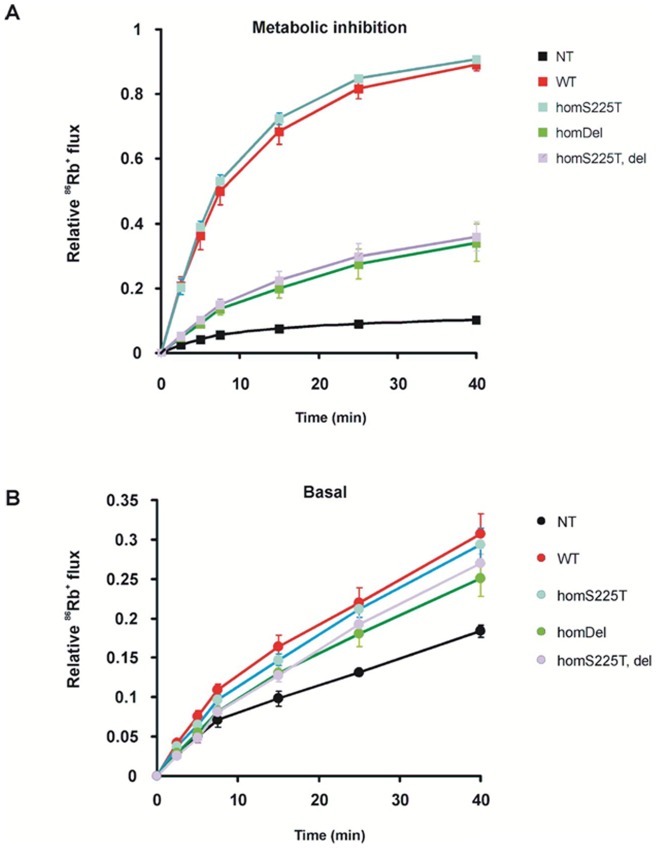
Figure 1. Decreased KATP activity in both homDel and homT, del channels.
Representative 86Rb+ efflux profile comparing untransfected COSm6 cells (Un) and cells transfected with WT, homS225T, homDel and homT, del channels in metabolic inhibition (A) and in basal conditions (B). Data points indicate means ± SEM of n = 4. NT = not transfected.

