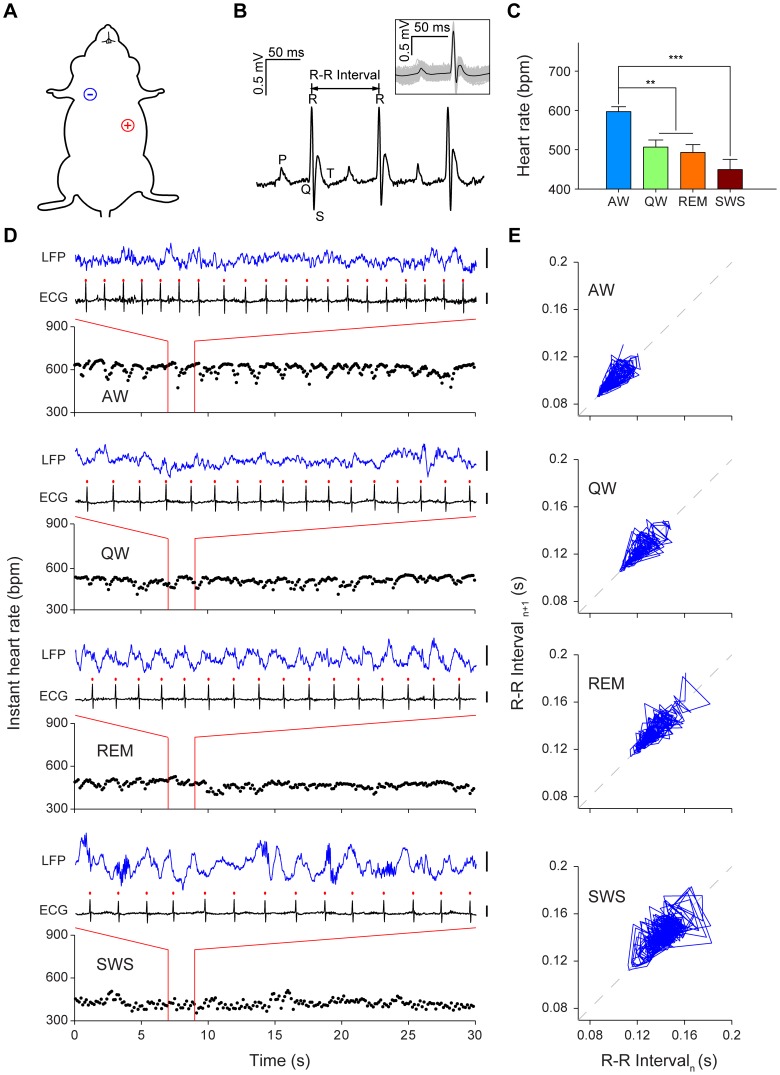
Figure 1. ECG recording during four behavioral states.
(A) Illustration of the proper ECG electrodes implantation sites on a mouse. The negative electrode (-) was implanted in the mouse’s right upper chest, and the positive electrode (+) was placed in the left abdomen. (B) Three consecutive cycles of heart beats as example of ECG recording. The peaks are labeled by conventional ECG terminology. Inset: average waveform of individual heart beats recorded in 1 minute, centered on the peak of the R-wave. (C) Mean heart rate of mice during four basic behavioral states in the home cage. AW, active wakefulness; QW, quiet wakefulness; REM, rapid eye movement sleep; SWS, slow wave sleep. Error bars, s.e.m.; n = 5; **P<0.01, ***P<0.001, one-way repeated measures ANOVA and Tukey post hoc test. (D) Examples of 30-sec instant HR and 2-sec ECG and hippocampal CA1 LFPs during AW, QW, REM and SWS from an individual mouse. The red dots indicate the peaks of the R-wave. Scales: 0.5 mV. (E) Poincaré plot analysis graphed the same mouse’s R-R interval data of four 1-min periods: during AW, QW, REM and SWS. Successive points in the plots were connected with a line.

