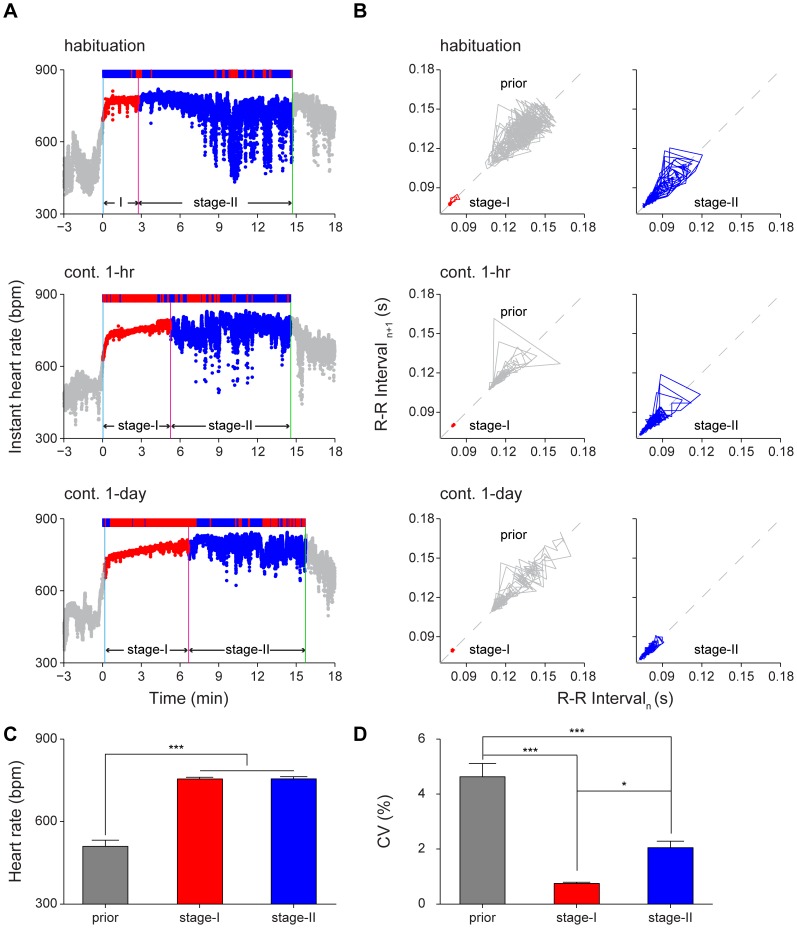
Figure 4. Increased duration of heart rate variability stage-I in long-term contextual memory retention test.
(A) The instant HR responses of an individual mouse showed clearly two distinct stages: stage-I (red) and stage-II (blue) during the contextual habituation and retention tests. Upper panel: contextual habituation; Middle panel: 1-hr contextual retention test; Lower panel: 1-day contextual retention test. The freezing responses were plotted on top of the instant HR; freezing state, red bar; non-freezing state, blue bar. The blue vertical line indicates the start of stage-I; the red vertical line indicates the end of stage-I; the green vertical line indicates the end of the contextual retention test. (B) Poincaré plots of the same mouse’s R-R intervals of 1-min duration in prior (grey line), stage-I (red line) and stage-II (blue line). The prior was a 3-min period before contextual habituation or retention. Upper panel: contextual habituation; Middle panel: 1-hr contextual retention test; Lower panel: 1-day contextual retention test. (C-D) The HR and CV of prior, stage-I and stage-II during 1-hr contextual retention. Error bars, s.e.m.; n = 11; *P<0.05, ***P<0.001, one-way repeated measures ANOVA and Tukey post hoc test.

