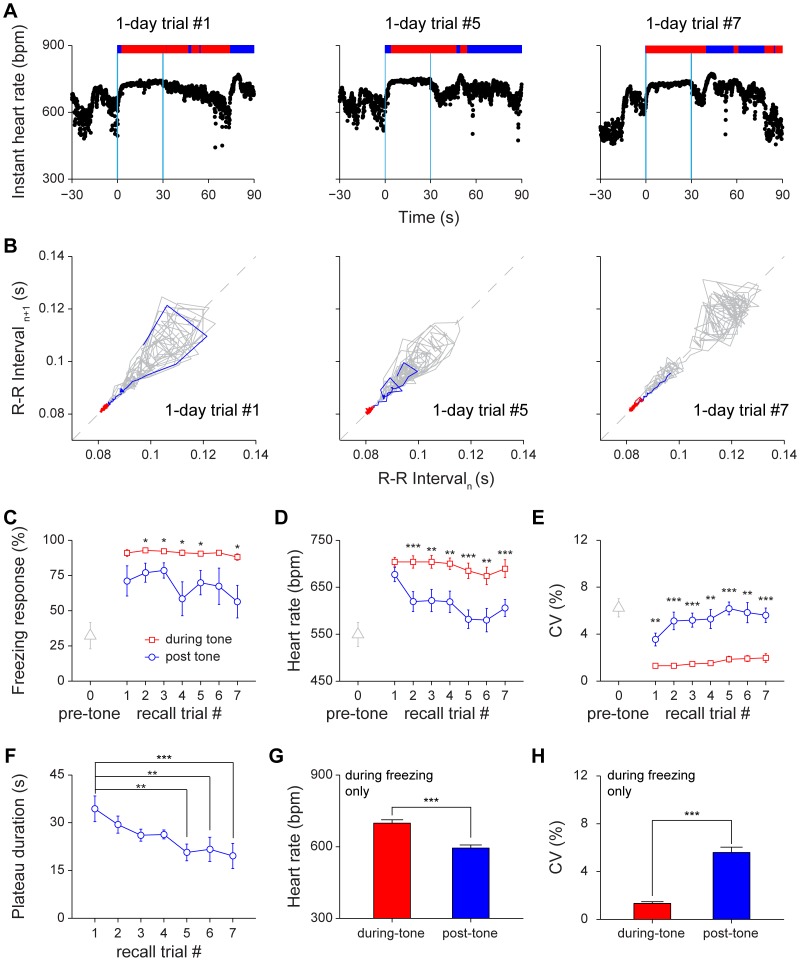
Figure 7. Changes of heart rate and heart rate variability during 1-day cued fear retention tests.
(A) Instant HR responses of the same mouse during three recall trials, trial#1, trial#5 and trial#7. The freezing responses were plotted on top of the instant HR; freezing state, red bar; non-freezing state, blue bar. The blue vertical lines indicate the onset and offset of the tone (30 seconds). (B) Poincaré plots of the same mouse’s R-R intervals of 30-sec pre-tone (grey line) and 30-sec during-tone (blue line and red line) in trial #1, trial #5 and trial #7. The blue line indicates the rising phase of instant HR, which was defined as a period from the onset of tone to the time when HRV reached the stage-I plateau. (C–E) The freezing responses, HR and CV of pre-tone, during-tone and post-tone during 1-day auditory cued retention. n = 8; *P<0.05, **P<0.01, ***P<0.001, paired t test. (F) The stage-I plateau durations during 1-day auditory cued retention. n = 8; **P<0.01, ***P<0.001, one-way repeated measures ANOVA and Dunnett’s multiple comparisons test. Dunnett’s multiple comparisons test comparing with recall trial #1 showed that extinction effect reached significant difference at trial #5. (G–H) The HR and CV of the during-tone and post-tone freezing period in 1-day auditory cued retention test. n = 8; ***P<0.001, paired t test. All data are plotted as mean ± s.e.m. (error bars).

