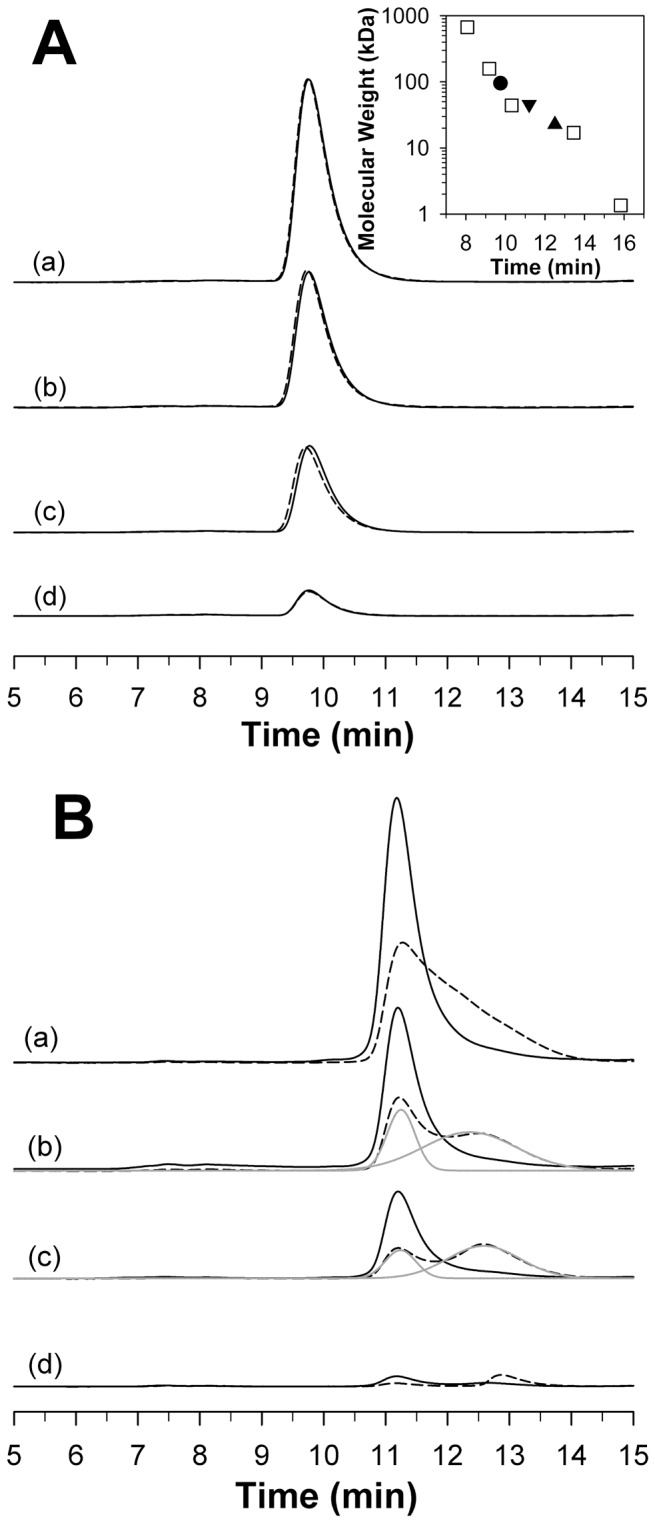
Figure 6. RP-mutant CaMnSODc is susceptible to dimer dissociation.

HPLC-SEC profiles of WT (solid line) and K182R, A183P (dashed line) ScMnSOD are shown in Panel A. Inset: The plot of the molecular weight of the five standards (square), ScMnSOD tetramer (circle) and CaMnSODc dimer (triangle down) and monomer (triangle up) versus their retention time. The column was calibrated using five standards: 1) bovine thyroglobulin (670 kDa), 2) bovine γ-globulin (158 kDa), 3) ovalbumin (44 kDa), 4) horse myoglobin (17 kDa), and 5) Vitamin B12 (1.35 kDa). HPLC-SEC profiles of WT (solid line) and K184R, L185P (dashed line) CaMnSODc are shown in Panel B. Deconvoluted peaks are shown in grey lines. The protein concentration relative to monomer was 1 µM (a), 750 nM (b), 500 nM (c) and 200 nM (d). The elution buffer contained 10 mM potassium phosphate (pH 6.7).
