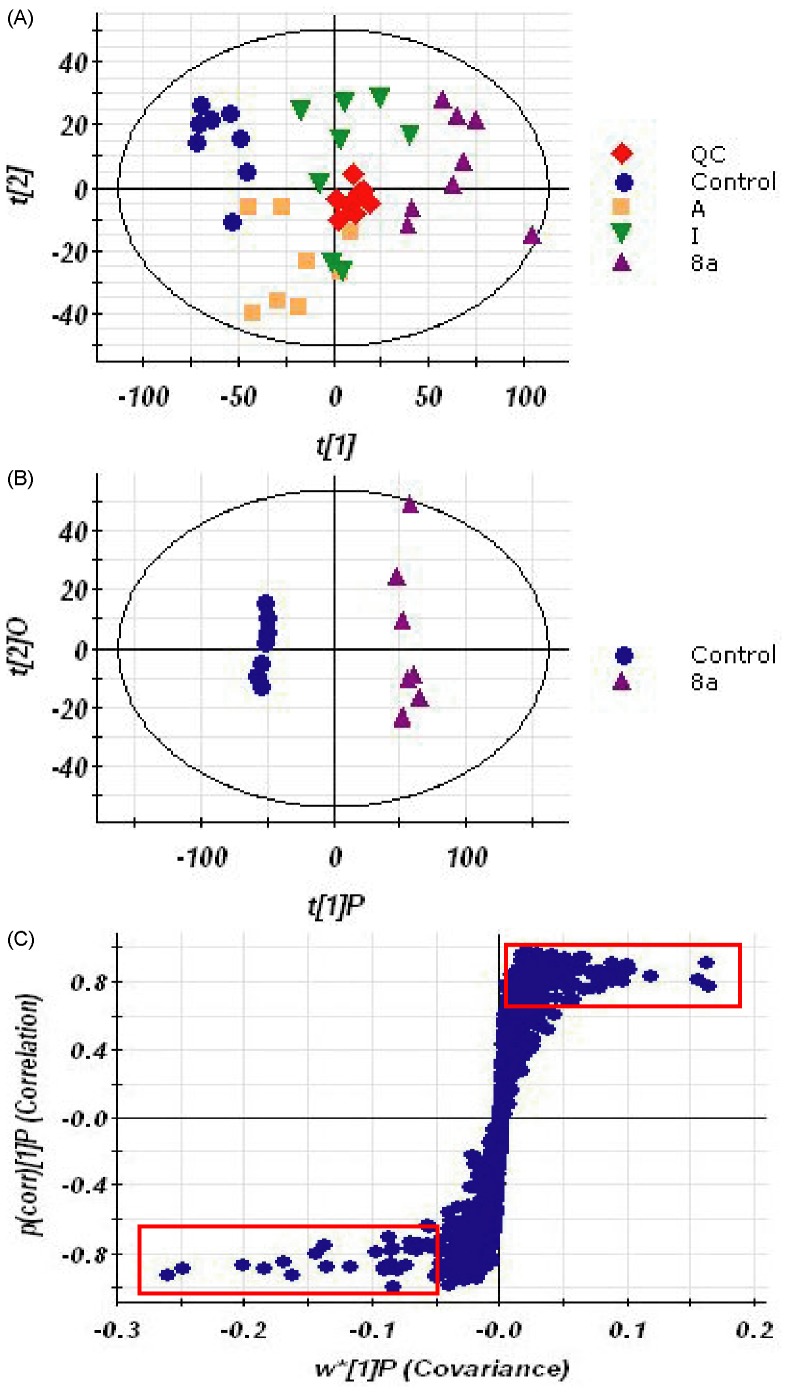
Figure 2. PCA scores plot resulting from the UPLC/MS spectra of CCRF-CEM cells with corresponding OPLS-DA for tested groups.
(A) PCA scores plot from control and 8a-treated group. (B) OPLS-DA scores plot from control and 8a-treated group. (C) Potential biomarkers in the S-plot between control and 8a-treated group.

