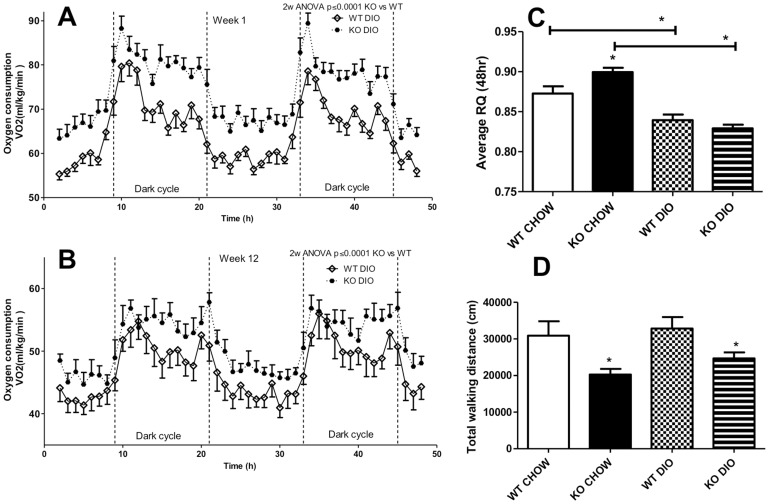
Figure 1. Oxygen consumption and locomotor activity.
(A and B): Oxygen consumption after diet treatment for one week (A) and 12 weeks (B), evaluated over a 48 hour period for wildtype (WT, open circles) and C5aRKO mice (solid circles) on a high fat high sucrose diet-induced obesity (DIO) diet. (C): Respiration quotient (RQ) for the same 48 hour period for WT and C5aRKO mice on CHOW or DIO diet. (D): Total walking distance over the 48-hour period for WT and C5aRKO mice on CHOW or DIO diet. Results are presented as means ± SEM of n = 8 mice per group. For calorimetry results, “dark cycle” indicates the active period. Data were analysed by 2-way RM-ANOVA (A and B) and by ANOVA followed by t-test (C and D), where *P<0.05 for C5aRKO vs WT on their respective diets, unless otherwise indicated.

