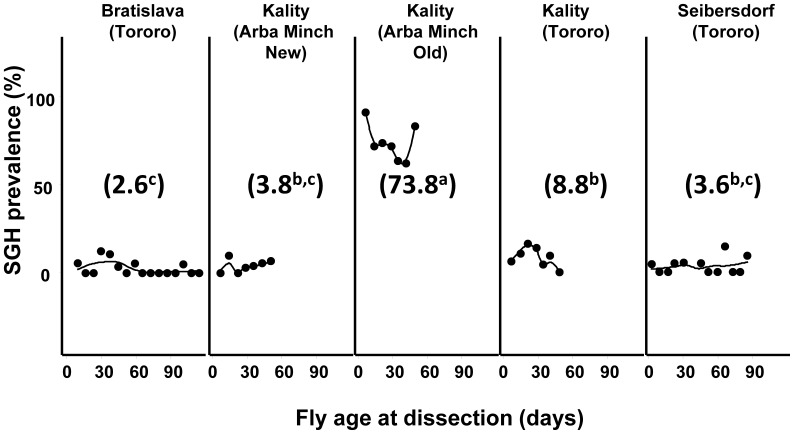
Figure 1. Prevalence of SGH in different tsetse colonies of G. pallidipes.
The flies were randomly selected at different time points from the different colonies and dissected to determine status of the salivary glands. Numbers between brackets are the mean SGH prevalence percentage. The line is the smoothed regression.

