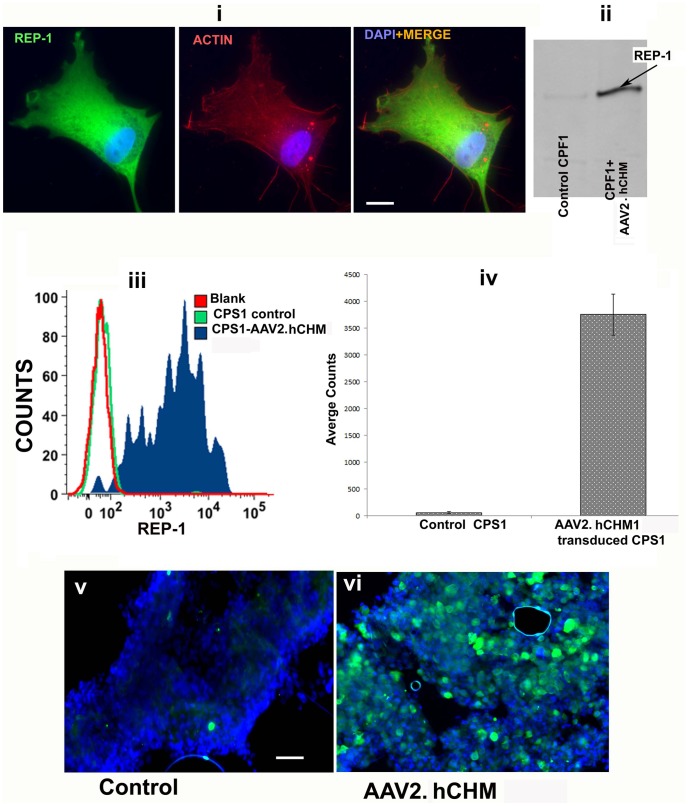
Figure 3. REP-1 protein is produced by fibroblasts [CPF1 (i, ii)] and iPSCs [CPF2 (iii, iv)] following AAV2.
hCHM infection: Fibroblasts and iPSCs of CHM individuals were infected with 2×10⁵ vg/cell AAV2. hCHM and production of REP-1 was assessed by immunofluorescence (i); western blot analysis (ii); and flow cytometry (iii, iv). Cytoplasmic distribution pattern of REP-1 was confirmed by co-staining with anti-actin antibody (i). Western blot analysis (ii) further confirmed the presence of REP-1 protein. FACS analysis of CHM iPSCs infected with AAV2. hCHM showed a high level of REP-1 protein compared to untransduced controls (iii,iv). Immunofluorescence showed high levels of REP1 protein in cells infected with AAV2. hCHM (vi) compared with controls (v). Nuclei are stained with DAPI. Scale bar is 50 uM. Data are representative of 3 independent experiments.

