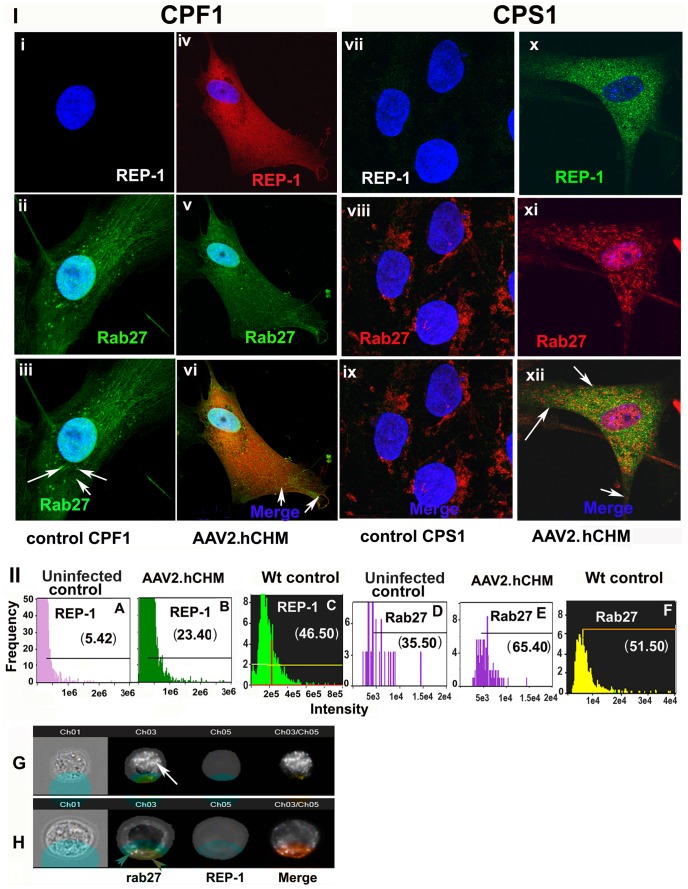
Figure 5. Trafficking of RAB27 protein is restored in affected cells after infection with AAV2.
hCHM. CPF1 fibroblasts (i–vi) or CPS1 iPSCs (vii–xii) derived from CHM individuals showed improved trafficking of RAB27 after infection with AAV2. hCHM. In control CPF1 (i–iii) or CPS1 (vii–ix) untreated cells, Rab 27a (Green) was localized near the nucleus, whereas infection with AAV2. hCHM favored trafficking of RAB27 out of the perinuclear region in both CPF1(Rep-1 red, RAB27-green) (v–vi) and CPS1 (xi–xii) cells (REP1-green; RAB27-red). Nuclei are stained with DAPI and appear blue. II). Quantitative analysis of REP-1 and RAB27 levels in CHM iPSCs measured with imageStream. Histograms represent the increased level of exogenous REP-1 in cells infected with AAV2. hCHM (B) compared to controls (A) and unaffected wt controls (C). However, the level of REP-1 in transduced cells is reduced compared to unaffected control cells (E). Labeled Rab was increased in the surface mask in transduced cells (E) compared to uninfected cells (D). The levels of membrane-associated Rab 27 are comparable to the levels observed in unaffected wild type controls (F) Panel G and H shows representative cell images demonstrating the trafficking of Rab 27 to cell membrane in grey-scale. From left to right are shown: Brightfield, Rab 27, and REP-1, followed by composite images of REP-1 and RAB27. The cell surface masks used to define the inside and surface of the cell are overlayed in Brightfield and RAB/REP-1 labeled cells. White arrow in panel G, accumulated Rab inside the cell. Red arrowheads in panel H, presence of membrane Rab.

