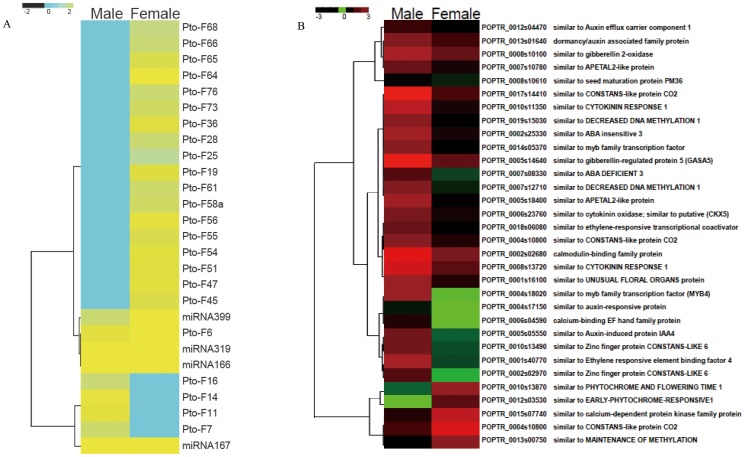
Figure 6. Pearson correlation Coefficient (PCC) heat map representing expression of miRNAs and their targets in andromonoecious poplar flower organs.
Red and yellow indicate higher levels of transcriot and green and blue indicate lower levels of transcript. The names of samples are shown at the top. The gene model and gene annotation are shown on the right side. A: Heatmap of conserved and novel miRNAs. B: Heatmap of target genes.

