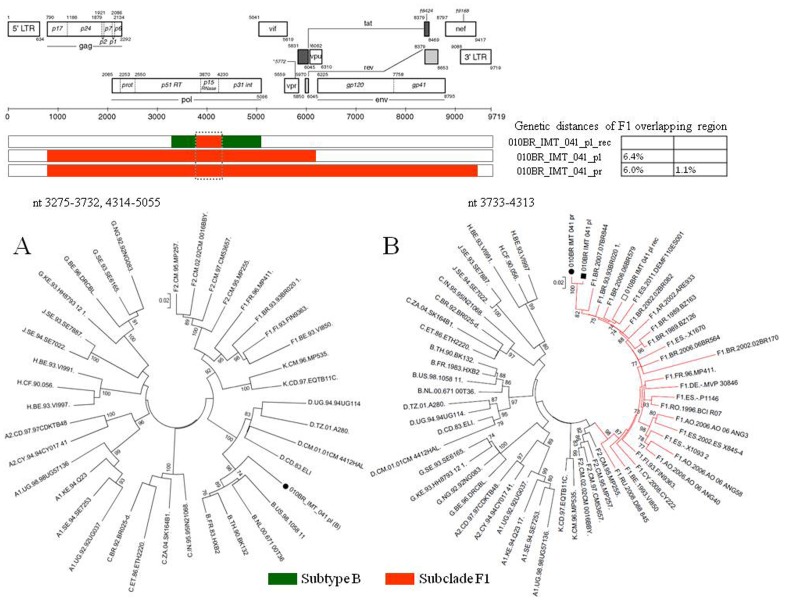
Figure 5. Genetic distances and phylogenetic tree constructed using a maximum-likelihood method of HIV isolates recovered from patient 01BR_IMT_041.
A: Phylogenetic tree from concatenated regions assigned as subtype B from the BF1 recombinant isolate. B: Phylogenetic tree showing the clustering pattern of F1 sequences (marked by dotted box). F1 region from genuine F1 sequence recovered from plasma and PBMCs are marked by a black circle and square, respectively while the F1 region from the BF1 recombinant sequence is marked by an empty square. The approximate likelihood ratio test (aLRT) values of ≥70% are indicated at nodes. The scale bar represents 0.05 nucleotide substitutions per site.

