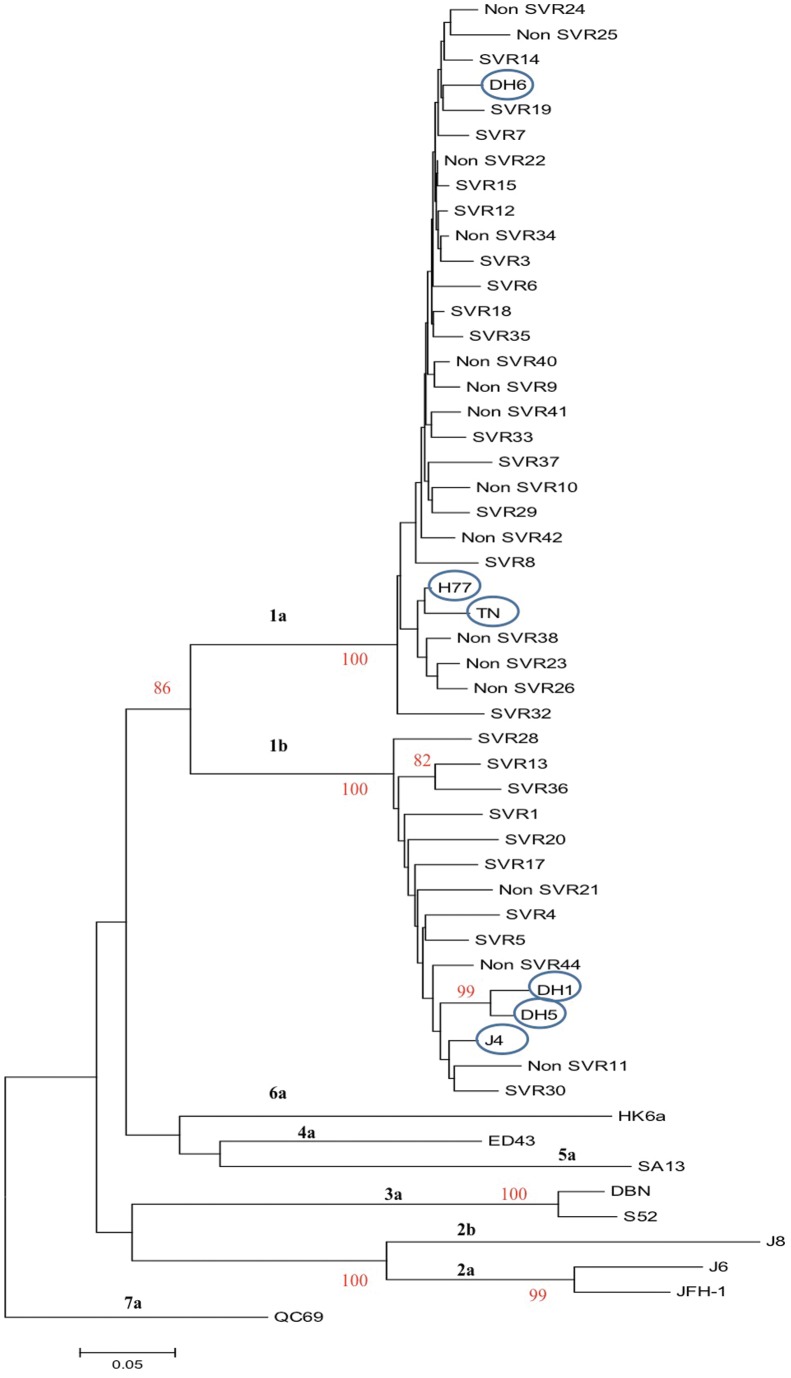
Figure 1. Phylogenetic analysis of the Core-E1 sequences of the HCV, genotype 1a and 1b, isolates from 38 patients.
The analysis includes the Core-E1-sequences (nts. 868–1288; GenBank accession number AF009606) (one of the 39 included patients could not be subtyped and is not included in the tree), the corresponding sequence of the included genotype 1 culture viruses (circled) and culture viruses of other HCV genotypes. The QC69 (genotype 7a) is included as an out-group. The percentage of 1000 replicates in which the associated taxa cluster together in the bootstrap test is shown when >80%. The phylogenetic tree was constructed using the neighbor-joining method in the MEGA5 software. Each patient was assigned with a study number (also shown in Table 2) and the treatment outcome (SVR and non-SVR) is noted. The scale indicates the evolutionary rate of the branches.

