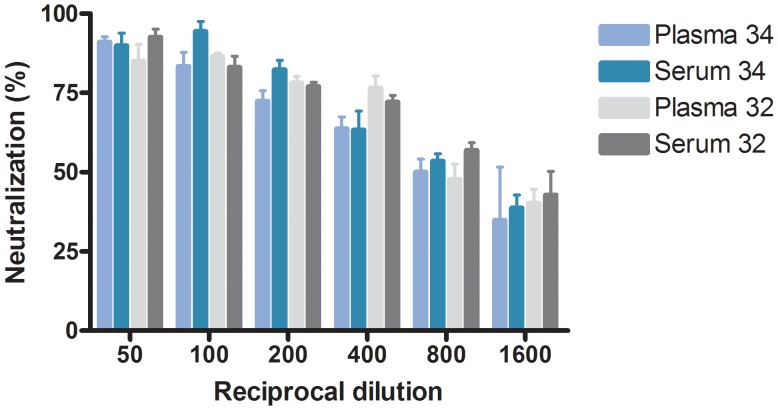
Figure 5. Testing the difference between plasma and serum in the neutralizing assay.
The graph shows the reciprocal dilution on the x-axis and the percent neutralization on the y-axis. Each bar represents either plasma or serum from selected patients. Patient no. 32 is marked in gray scale and patient no. 34 is marked in blue scale colors. Error bars indicate SEM of triplicate determinations.

