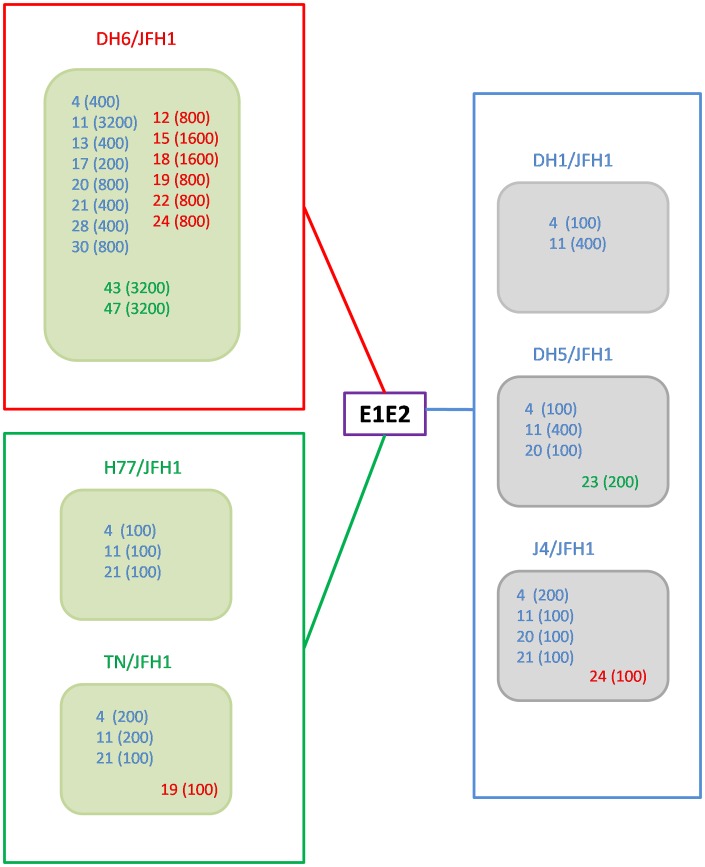
Figure 8. Phylogenetic relationship of the envelope sequence of the patient derived viruses and the culture viruses with associated NAb50-titer.
16 patient derived viruses and 6 culture viruses divided into three groups according to the sequence of the E1E2 analyzed in a phylogenetic tree (see Figure 7). The clusters are marked by different colors of the names of the samples and viruses, including a box framing the viruses in the cluster. Blue = genotype 1b, cluster 1; Red = genotype 1a, cluster 2; Green = genotype 1a, cluster 3. Only plasma samples with NAb50-titer ≥100 against genotype 1a viruses (green squares) and genotype 1b viruses (grey squares) are shown. The patient number is written in the squares and the titer against the virus is written in parentheses.

