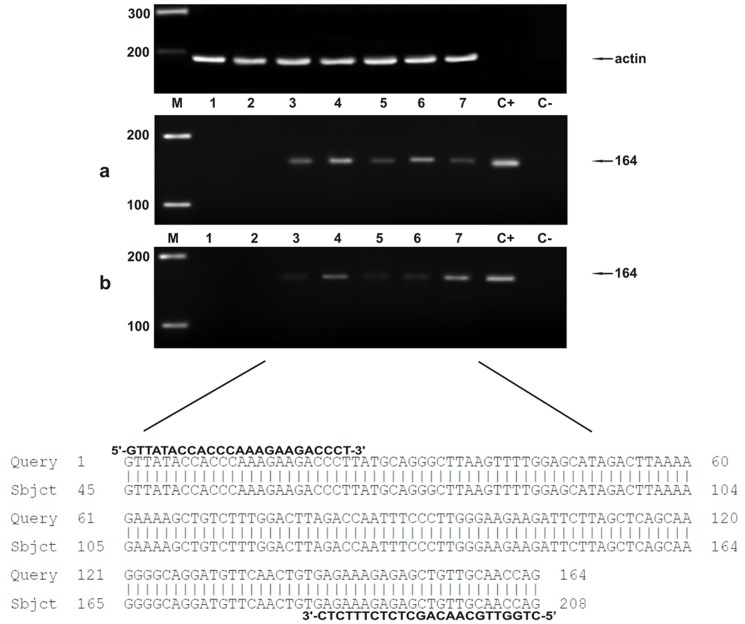
Figure 2. PCR amplification of DNA samples.
a) Lane M, molecular mass marker (HyperLadder II Bioline); lanes 1–2 urinary bladder samples from healthy cows without BPV-2 L1 DNA; lanes 3–7 bladder tumors samples from five of twenty cows showing BPV-2 L1 DNA; lane C+, positive control (cloned BPV-2 DNA); lane C-, negative control (no DNA added). The arrow indicates the position of the 164 bp BPV-2 L1 PCR product. b) Lane M, molecular mass marker (HyperLadder II Bioline); lanes 1–2 urinary bladder samples from healthy buffaloes without BPV-2 L1 DNA; lanes 3–7 bladder tumors samples from five of twenty-one buffaloes showing BPV-2 L1 DNA; lane C+, positive control (cloned BPV-2 DNA); lane C-, negative control (no DNA added). The arrow indicates the position of the 164 bp BPV-2 L1 PCR product. The lower part of the figure shows 100% homology between the sequence of the amplicons in lanes 3–7 and the sequence of BPV-2 L1 found in Italy (GenBank M20219).

