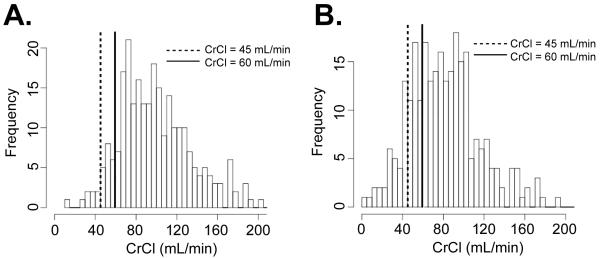
Figure 1.
CrCl distribution histograms. (A) Baseline CrCl distribution as calculated by the Cockcroft-Gault formula. Vertical lines indicate thresholds for chemotherapy administration. (B) Distribution of the lowest (nadir) CrCl achieved in the patient population at any time, as calculated by the Cockcroft-Gault formula. Vertical lines indicate thresholds for chemotherapy administration. (solid: 60 mL/min, dashed: 45 mL/min)

