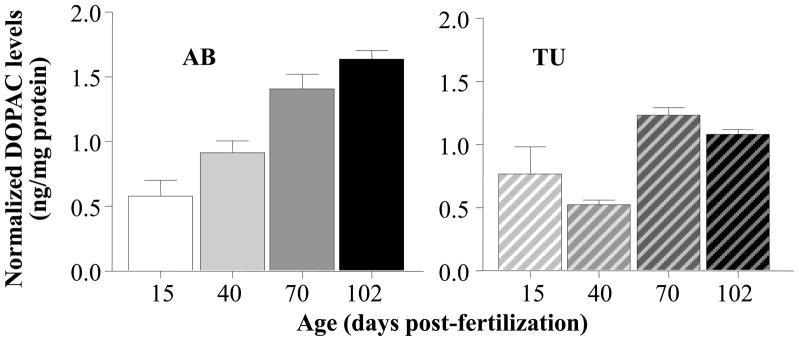
Figure 5.

Strain dependent increase of normalized DOPAC levels in the brain as zebrafish mature. Mean ± S.E.M. are shown. The solid colored bars on the left represent the results obtained for strain AB and the striped bars on the right the results obtained for strain TU. Note the quasi-linear increase of relative DOPAC levels in AB zebrafish and the step wise increase between ages 40 and 70 days-post-fertilization in TU zebrafish. Last, note that DOPAC levels are expressed as relative to total brain protein weight.
