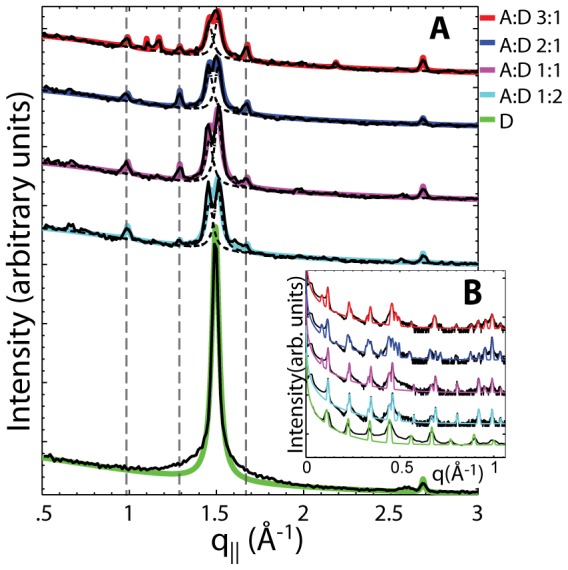
Figure 3.

Projections of the 2-dimensional data in Figures 2 along the A in-plane and B out-of-plane axis. AMP:DMPC 3∶1 (red); AMP:DMPC 2∶1 (blue) AMP:DMPC 1∶1 (magenta); AMP:DMPC 1∶2 (cyan); DMPC only (green). The lateral arrangement of the AMP molecules was determined from the in-plane peaks in A. The distance between two bilayers in the stack is determined by the analysis of the out-of-plane reflections in B.
