
Figure 5.
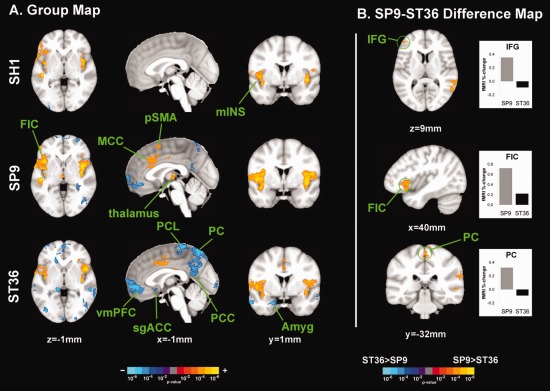
Brain response to stimuli at different acupoints. A: FMRI response group maps for SH1, SP9, and ST36 stimulation suggested heterogeneity in brain response. B: SP9 stimulation elicited greater activation in right IFG and FIC, compared to ST36. However, ST36 stimulation elicited more deactivation in the PC. n.b. amyg, amygdale; MCC, middle cingulate cortex; IFG, inferior frontal gyrus; mIns, middle insula; PC, precuneus; PCC, posterior cingulate cortex; PCL, paracentral lobule; FIC, fronto‐insular cortex; sgACC, subgenual ACC; vmPFC, ventromedial prefrontal cortex. [Color figure can be viewed in the online issue, which is available at http://wileyonlinelibrary.com.]