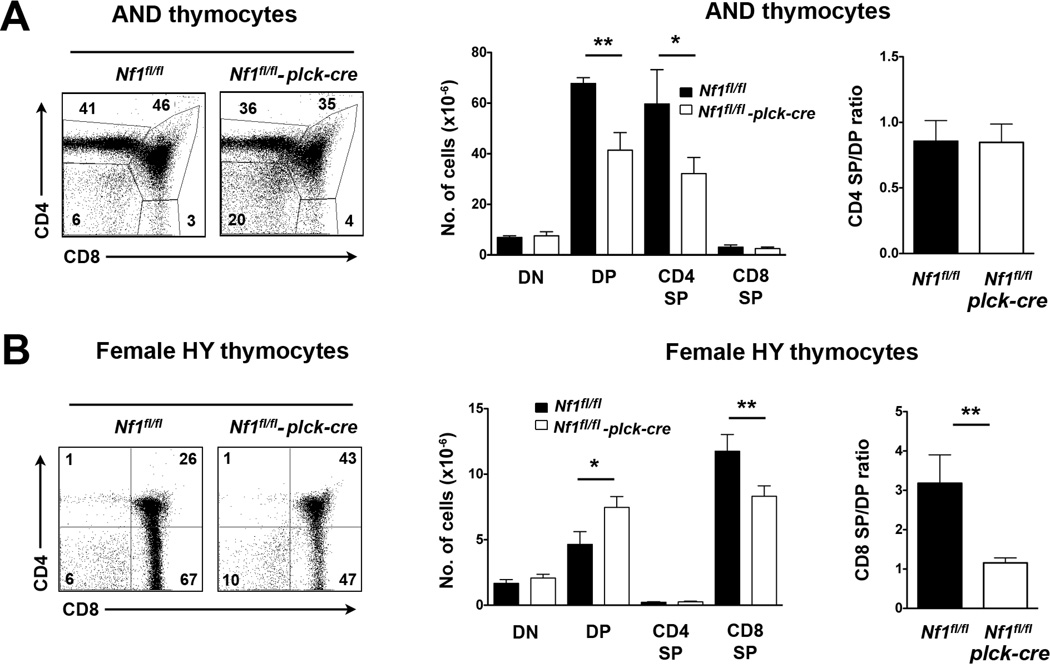
Fig. 3.
Positive selection in T cell-specific NF1-deficient TCR Tg mice. A, All experiments were performed with littermate Nf1fl/fl and Nf1fl/fl plck-cre AND TCR Tg mice. At left are shown representative two-color flow cytometry plots of CD4 versus CD8 staining of AND TCR+ thymocytes (TCR Vα 11+, Vα 3+) in whole thymi. The bar graph at middle shows the mean number plus 1 SEM of the indicated thymocyte populations (Nf1fl/fl, n=5; Nf1fl/fl plck-cre n=10). For each mouse the CD4 SP/DP ratio was calculated. The bar graph at right shows the mean CD4 SP/DP ratio plus 1 SEM. B, All experiments were performed with littermate female Nf1fl/fl and Nf1fl/fl plck-cre HY TCR Tg mice. At left are shown representative two-color flow cytometry plots of CD4 versus CD8 staining of HY TCR+ thymocytes (reactive with clonotypic HY TCR antibody) in whole thymi. Bar graphs show the mean number plus 1 SEM of the indicated thymocyte populations and the mean CD8 SP/DP ratio plus 1 SEM calculated as in A (n=6 mice each genotype). Statistical significance was determined using a Student two-sample t test. *p < 0.05, **p <0.01.

